Which equity factor model is best among non-U.S. global stock markets? In other words, what market/accounting variables are most important to investors screening non-U.S. stocks? In his February 2020 paper entitled “A Comparison of Global Factor Models”, Matthias Hanauer compares eight widely used equity factor models on a common dataset spanning stocks from 47 non-U.S. developed and emerging markets based on gross Sharpe ratio. The models are:
- The Capital Asset Pricing Model (CAPM) – market.
- FF3 (3-factor) – market, size, book-to-market.
- FF5 (5-factor) – adds profitability based on operating profits-to-book equity and investment to FF3.
- FF6 (6-factor) – adds momentum to FF5.
- FF6CP (6-factor) – substitutes cash-based operating profits-to-assets for the profitability factor used in FF6.
- HXZ4, or q-factor (4-factor) – market, size, profitability based on return-on-equity (ROE), investment.
- SY4, or Mispricing (4-factor) – market, size, management, performance.
- FF6CP,m (6-factor) – substitutes a monthly value factor for the annual value factor in FF6CP.
He employs annual accounting data because quarterly data are unavailable in many countries at the beginning of my sample period. Using factor input and return data for 56,171 stocks across developed and emerging markets during 1990 through 2018, he finds that:
- All factors considered generate positive and, other than market and size, statistically significant average excess returns outside the U.S.
- FF6CP,m dominates other models in-sample, with Sharpe ratio boosts of 20% to 50% over other complex models. Dominance persists out-of-sample, across 5-year subperiods and across three global regions (Europe, Asia-Pacific and Japan). Dominance is stronger over simpler models and robust to methodological changes.
- The main advantage of FF6CP,m over other models is their failure to explain the monthly-updated value factor.
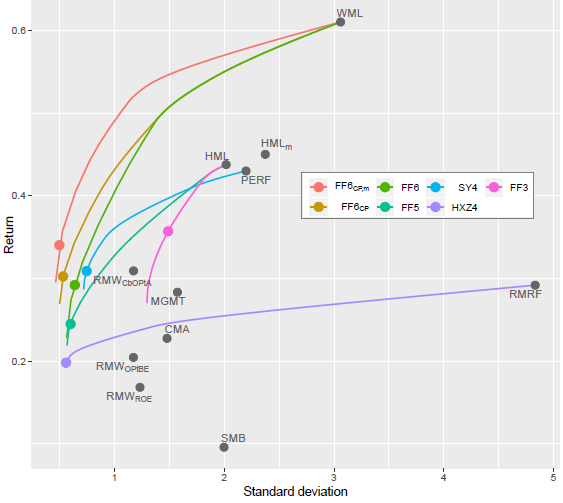
The following chart, taken from the paper, summarizes efficient frontiers for competing equity factor models (with symbols as above), and for 11 individual factors:
- Market (RMRF)
- Size (SMB)
- Value reformed annually (HML)
- Value reformed monthly (HMLm)
- Momentum (WML)
- Operating profits-to-book equity (RMWOPtBE)
- Cash-based operating profits-to-assets (RMWCbOPtA).
- Profitability based on ROE (RMWROE)
- Investment (CMA)
- Management (MGMT)
- Performance (PERF)
FF6CP,m offers the best set of return-versus-risk choices, followed by FF6CP and FF6. In other words, compared to other models: (1) including momentum is important; (2) measuring profitability based on cash flow is important; and, (3) measuring value monthly is important.

In summary, evidence outside the U.S. indicates that six variables (market, size, book-to-market measured monthly, momentum, cash-based profitability and investment) comprise the best linear model of stock returns of models widely in use.
Cautions regarding findings include:
- Findings are gross, not net. Accounting for trading frictions associated with factor portfolio reformation and shorting costs would reduce returns and Sharpe ratios for all models. Moreover:
- Shorting may not always be feasible as assumed.
- Different factor models may drive different turnovers (such as for monthly vice annual value factor), such that net relative performance of models may differ from gross relative performance.
- Testing many factors and models on the same sample introduces data snooping bias, such that the best-performing models may be luckier and thus overstate explanatory/predictive power. Similarities to findings for U.S. stocks mitigates this concern. There may be further bias inherited from research discovering the individual models.
For a sense of the breadth of equity factor model research (mostly on U.S. data), see results of this search.