How should an investor’s view of the equity risk premium vary with investment horizon? In the December 2017 update of their paper entitled “Volatility Lessons”, Eugene Fama and Kenneth French examine how the U.S. equity risk premium (difference in returns between the expected equity market return over some horizon and return on U.S. Treasury instrument of matched duration) varies across investment horizons ranging from one month to 30 years. To generate distributions of equity risk premiums for horizons longer than one month, they employ bootstrap simulations. Specifically, for each matched horizon/duration, they randomly draw 100,000 pairs of stock market and U.S. Treasury instrument returns with replacement from a base sample of monthly data, without or with an adjustment for uncertainty in associated equity premiums. They repeat analyses on three value portfolios (Market Value, Big Value and Small Value) and on a Small stock portfolio with no value tilt, defining size and value as follows: (1) big (small) stocks are U.S. listed stocks with market capitalizations above (below) the NYSE median; and, (2) value stocks are U.S. listed stocks with book-to-market ratios above the 70th percentile of those for NYSE stocks. All style portfolios are capitalization-weighted and rebalanced annually at the end of June. Using monthly U.S. stock returns and and U.S. Treasury instrument yields across durations during July 1963 through December 2016 (642 months), they find that:
- Over the sample period, the average monthly equity risk premium is 0.51% (about 6% per year), with standard deviation 4.42% (almost nine times the average).
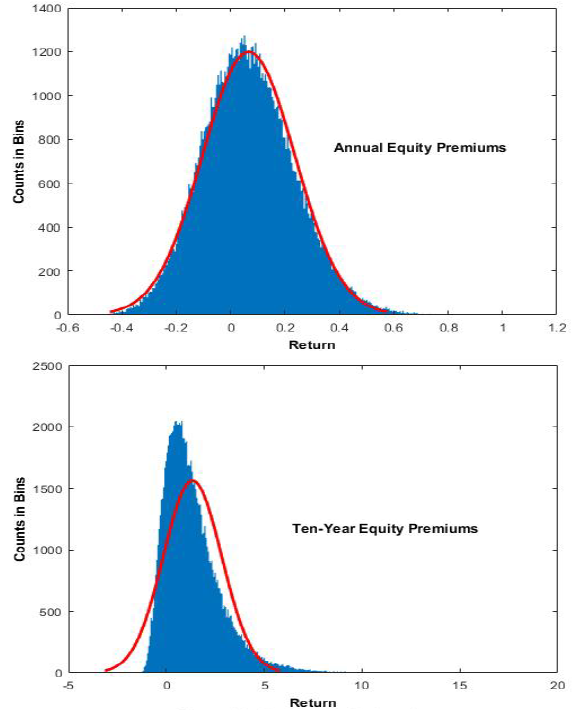
- As investment horizon increases, premium distributions disperse and move to the right (higher values) faster than they disperse (see the charts below). For example, results without correction for uncertainty in return distributions are:
- Standard deviation increases from 17% for annual premiums to 2551% for 30-year premiums.
- Skewness is -0.53 for monthly premiums and ranges from 0.25 to 3.78 for annual to 30-year premiums.
- Kurtosis is is 4.97 for monthly premiums (somewhat fat-tailed compared to 3.00 for a normal distribution), falls to 3.19 for annual premiums but then rises strongly to 32.4 for 30-year premiums.
- Together, increasing kurtosis and positive (right) skewness for longer horizons spread good outcomes in the right tail more than the bad outcomes in the left tail.
- The percentage of negative premiums falls from 41.3% for monthly measurements to 4.08% for 30-year measurements. For 3-year and 5-year intervals professional investors commonly use to evaluate asset allocations, simulated probabilities of negative equity premiums are 28.6% and 23.4%, respectively.
- Accounting for uncertainty in return distribution statistics has little effect on median outcomes but increases dispersion of premiums. These effects are small for horizons of five years or less.
- Regarding the size and value premiums:
- For monthly measurements, average premiums relative to the market return range from 0.20% for Big Value to 0.52% for Small Value, with Market Value premium 0.29%. The Small premium is 0.27%.
- Behaviors of these premiums across longer investment horizons are similar to those above for the equity premium. Distributions spread, shift right and become increasingly fat-tailed as horizon increases. Except for the extreme left tail, premium distributions move to the right faster than they disperse.
- For a 3-year (5-year) horizon, probabilities of underperforming the market range from 18.0% (11.7%) for Small Value to 34.1% (29.8%) for Small.
The following charts, taken from the paper, compare simulated equity risk premium (“Return”) distributions for short-term (one year) and long-term (10 years) investment horizons. The red curves are matched normal distributions (same means and standard deviations as the respective premium distributions). Results show that the distribution of annual equity premiums is close to normal but exhibits some right skewness and excess kurtosis. As investment horizon increases to 10 years, distributions disperse asymmetrically as right skewness and kurtosis both increase.

In summary, evidence indicates that the statistics of the equity risk premium change substantially with investment horizon, and investors should plan allocations to stocks accordingly.
Cautions regarding findings include:
- The sample period July 1963 through December 2016 may not be representative of longer term market behaviors and is very short for evaluation of long investment horizons. For example, equity market volatility is higher in the decades prior to the sample period.
- Market, small and value portfolios are essentially indexes, with annual rebalancing for the latter two, ignoring costs of maintaining a fund that tracks them. Many stocks disappear over long investment horizons.