How can the retail trader tail wag the market dog? In their February 2021 paper entitled “The Equity Market Implications of the Retail Investment Boom”, Philippe van der Beck and Coralie Jaunin quantify impacts of the Robinhood-catalyzed retail trading boom on the U.S. stock market. They focus on the early part of the COVID-19 pandemic, during which retail trading soars and institutional investors rebalance their portfolios. They approximate retail trading based on account holdings data from RobinTrack and institutional rebalancing based on SEC Form 13F filings. Using RobinTrack account U.S. common stock holdings data as available through the first half of 2020 (discontinued August 2020) and institutional common stock holdings as disclosed in 13F filings during January 2005 through June 2020, they find that:
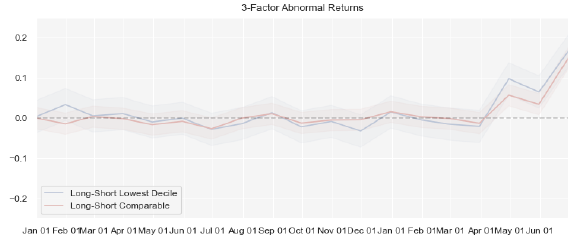
- Stocks with relatively high Robinhood demand outperform similar stocks during the second quarter of 2020. Each additional 1,000 buyers of a stock via Robinhood adds an average 0.2% to its quarterly return. The tenth (decile) of stocks most bought by Robinhood traders add an average 35% to quarterly returns (see the chart below).
- Institutions hold roughly 65% of U.S. equities, but inelastic institutional demand lets Robinhood traders (holding just 0.2% of U.S. equities) substantially influence stock returns.
- During the second quarter of 2020, Robinhood traders account for over 7% of cross-sectional variation in stock returns.
- As of July 2020, buying 10% of GameStop shares outstanding translates into a 57% increase in price.
- Without the surge in retail trading, the overall U.S. stock market capitalization would have been 2% lower in the first quarter and 1% lower in second quarter of 2020, implying a 5% to 10% multiplier for Robinhood traders.
- Robinhood trader price impact concentrates in small stocks and the consumer staples
sector. In July 2020, Robinhood demand accounts for 30% of the market for the smallest fifth of stocks. - Robinhood traders can impact prices of large firms predominantly held by passive institutional investors.
The following chart, taken from the paper, tracks during April 2017 through June 2020 3-factor (market, size, book-to-market) model alphas (abnormal returns) for two equal-weighted, monthly rebalanced hedge portfolios:
- Long-Short Lowest Decile (red line) – long stocks in the highest decile of Robinhood demand during the second quarter of 2020 and short stocks from the same industry and of similar size.
- Long-Short Comparable (blue line) – long stocks in the highest decile of Robinhood demand during the second quarter of 2020 and short stocks in the lowest decile of Robinhood demand during the second quarter of 2020.
Results quantify (in-sample) the influence of Robinhood traders.

In summary, evidence indicates that retail traders acting in concert can substantially impact prices of stocks with relatively small market capitalizations and passive institutional investors.
Cautions regarding findings include:
- The sample period is very short in terms of variety of market conditions.
- Modeling is complex, with multiple assumptions subject to uncertainty.
- Returns are gross, not net. Accounting for trading frictions and shorting costs would reduce all returns. Shorting may not always be feasible as specified. Trading frictions and shorting constraints are generally more severe for small stocks than large stocks.
- Analyses are in-sample. Exploitation of findings requires usefully accurate predictions of retail (Robinhood) trader activities.
For related research, see results of this search.