Does success in the U.S. equity market depend on an ever- shrinking percentage of outperforming stocks? In his February 2020 paper entitled “Wealth Creation in the U.S. Public Stock Markets 1926 to 2019”, Hendrik Bessembinder updates his analysis of wealth creation in excess of 1-month U.S. Treasury bills (T-bills) across U.S. stocks since 1926 by adding 2017-2019. Wealth creation differs from market capitalization by accounting for all cash flows to and from shareholders via new share issuances, share repurchases and dividends not reinvested in stocks. Using price, share issuance/repurchase and dividend data for 26,168 U.S. stocks and the T-bill yield during 1926 through 2019, he finds that:
- Net wealth creation from U.S. stocks during 1926 through 2019 is $47.38 trillion, an increase of $12.56 trillion since the end of 2016.
- Over the full sample period, 11,036 stocks (42.2%) create wealth and 15,132 (57.8%) destroy wealth over their respective lifetimes.
- During 2017-2019:
- The top 50 stocks in terms of lifetime wealth creation account for 47.5% of the $12.56 trillion increase in stock market wealth creation.
- Five stocks (Apple, Microsoft, Amazon, Alphabet and Facebook) account for 22.1%
- One stock (Apple) accounts for 7.2% and another (Microsoft) accounts for 6.2%.
- In addition to 2017-2019, net wealth creation exceeds $5 trillion during 1996-98, 2011-2013 and 2014-16. In contrast, net wealth creation is negative during 1930-32, 1939-41, 1969-71, 1972-74, 1999-2001 and 2008-2010.
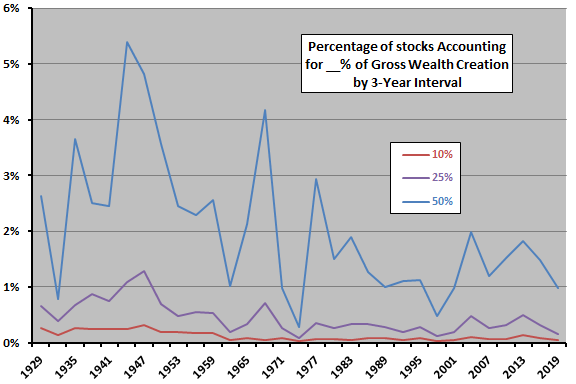
- Across 31 distinct 3-year intervals since 1926, stock market wealth creation becomes more concentrated (see the chart below), and is especially concentrated during 2017-2019. For example, on average for sequential 3-year intervals during the full sample period, 0.45% of stocks account for 25% of gross wealth creation. For the subperiod through (after) 1995, this percentage is 0.50% (0.29%). During 2017-2019, the percentage is just 0.16%.
The following chart, constructed from data in the paper, tracks over the full sample period percentages of firms accounting for 10%, 25% and 50% of gross wealth creation during consecutive 3-year intervals. While the series are volatile, trends generally indicate increasing concentration of wealth creation among smaller percentages of stocks over time.

In summary, evidence from the past 94 years suggests that a shrinking percentage of stocks are driving U.S. equity wealth creation.
Cautions regarding findings include:
- Given the volatility of results, the sample is short for concluding that concentration of wealth creation is systematically increasing.
- The study does not address potential strategies for exploiting concentration of wealth creation by, perhaps, holding portfolios concentrated according to some measure of firm success.
See also “T-bills Beat Most Stocks?” and “T-bills Beat Most Global Stocks?”.