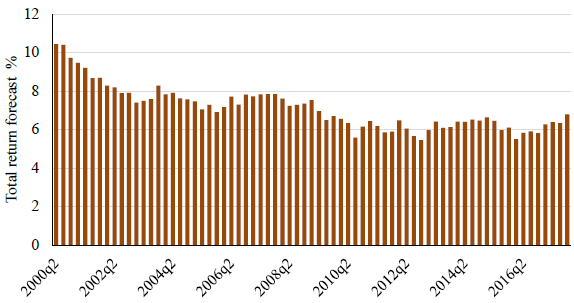
How do the corporate experts most responsible for assessing the cost of equity currently feel about future U.S stock market returns? In their March 2018 paper entitled “The Equity Risk Premium in 2018”, John Graham and Campbell Harvey update their continuing study of the views of U.S. Chief Financial Officers (CFOs) and equivalent corporate officers on the prospective U.S. equity risk premium (ERP) relative to the 10-year U.S. Treasury note (T-note) yield, assuming a 10-year investment horizon. Based on 71 quarterly surveys over the period June 2000 through December 2017 (an average 351 responses per survey), they find that:
- CFOs on average currently expect an annualized total return of 6.79% for the S&P 500 Index over the coming decade (see the chart below). With a T-note yield of 2.37%, this expectation implies an ERP of 4.42%, higher than the 3.63% average for the entire series of surveys.
- The standard deviation of individual responses in the most recent survey is 3.49%, a level of disagreement above the series average of 2.81% but lower than the peak disagreement of 4.13% in February 2009.
- Associated personal interviews indicate that CFOs follow the stock market closely. They interpret ERP as the long-term return above the T-note yield of buying and holding equities, so their average estimate indicates a geometric rather than arithmetic mean return.
- Simple statistical analyses suggest that the survey-based prospective ERP relates:
- Weakly negatively to prior-year stock returns.
- Slightly positively (but probably non-linearly) to the aggregate stock market forward price-earnings ratio.
- Negatively to the real interest rate (but not at all when the real interest rate is positive).
- Positively (correlation 0.26) to the implied volatility of the S&P 500 Index (VIX), but with a decoupling over the past few years.
- Positively (correlation 0.42) to the credit spread (Moody’s Baa rated bond yield less the T-note yield), but also with a recent decoupling.
The following chart, taken from the paper, shows the series of expected 10-year annualized total returns for the S&P 500 Index as forecasted by CFOs participating in quarterly surveys. Expected return from U.S. stocks has generally declined over the sample period. Separate analyses indicate:
- The correlation between these total return forecasts and actual S&P 500 Index return until the next survey (two surveys hence) is -0.31 (-0.42), indicating a wrong-way lean with respect to near-term market performance.
- The correlation between associated ERP forecasts and the actual S&P 500 Index return until the next survey (two surveys hence) is 0.01 (0.05), indicating practically no relationship to near-term market performance.

In summary, the most recent survey of U.S. CFOs indicates an above-average prospective U.S. equity risk premium relative to T-note yield (but a below-average raw stock market return because the T-note yield is low) and an above-average level of uncertainty (disagreement).
Cautions regarding findings include:
- As noted in the paper, sample duration is much too small to measure the accuracy of 10-year return/ERP outlooks.
- Sample size is modest for analysis of the relationships between ERP forecasts and other variables.