Do bonds have a bad rap based on an unfavorable subsample? In the September 2019 revisions of his papers entitled “The US Bond Market Before 1926: Investor Total Return from 1793, Comparing Federal, Municipal, and Corporate Bonds Part I: 1793 to 1857” and “Part II: 1857 to 1926”, Edward McQuarrie revisits analysis of returns to bonds in the U.S. prior to 1926. He focuses on investor holding period returns rather than yields, considering U.S. Treasury, state, city and corporate debt. Specifically, he estimates returns to a 19th century diversified bond portfolio comprised of all long-term investment grade bonds trading in any year (free of contaminating factors such as circulation privileges and tax exemptions). Returns assume:
- Weights are proportional to amounts outstanding.
- Bonds are far from before maturity.
- Calculations use actual bond prices.
In other words, he calculates performance of a diversified index fund tracking actual long-term, investment-grade 19th century U.S. bonds. He also calculates returns to sub-indexes as feasible. He further constructs a new stock index for the period January 1793 to January 1871 and revisits conclusions in Stocks for the Long Run about relative performances of stocks and bonds. Using newly and previously compiled U.S. bond and stock prices extending back to January 1793, he finds that:
- Over the 133 years during 1793-1926, real annualized return on bonds is 4.9% (notably higher than the 3.6% in Stocks for the Long Run). Bonds do much better in the 19th century than the 20th, due largely to recurrence and prevalence of deflation in the former.
- During 1793-1900 (1900-1926) the real return on bonds is 5.9% (0.9%).
- Real annualized bond return are 8.8% during the long interval of deflation after the Civil War and 7.0% over 45 years of declining or stable prices after the War of 1812.
- Prior studies supporting Stocks for the Long Run estimate pre-Civil War bond returns from inconsistently selected yield data using a formula ill-suited to structural peculiarities of early bonds, without consideration of tax exemption for some.
- The new early stock index is less positive than prior estimates because it includes: (1) the 1837 failure of the 2nd Bank of the United States, which wiped out 25% of U.S. stock market capitalization; (2) turnpikes and canals, notably poor performers, and railroads that failed in the 1830s, 1840s and 1850s; and, (3) actual rather than constant estimated dividends.
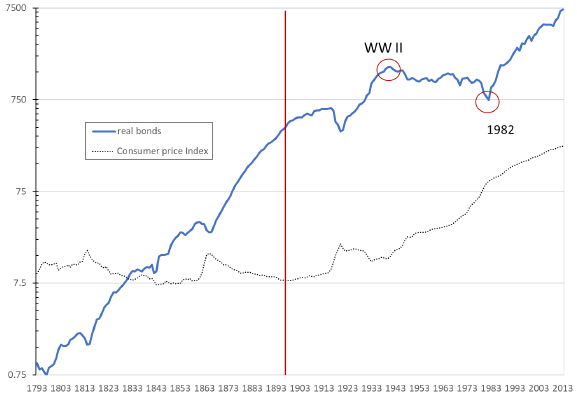
- Comparing revised return series for the bond index (see the chart below) and the stock index during January 1793 to January 2013:
- Up to about 1900, stocks and bonds both have annualized returns a little under 6%.
- In the 20th century, for the first time, stocks dramatically beat bonds, with outperformance concentrating during January 1942 to January 1982. As recently as January 1942, U.S. evidence does not support a “stocks for the long run” thesis.
- Since 1982, bonds again keep pace with stocks. Without the bond abyss of 1942-1982, there would be no case for “stocks for the long run.”
The following chart, taken from the paper tracks U.S. bond index real cumulative return and the U.S. Consumer Price Index (CPI) during January 1793 to January 2013. A vertical red line separates 19th and 20th centuries. Red circles indicate the beginning (World War II) and end (1982) of the bond “abyss.” The 19th century has much stronger bond returns than the 20th due to this abyss. Annualized real returns are 5.9% during 1793-1900, 0.6% during 1900-1982 and 7.6% during 1982-2013. The return is negative during the four decades beginning with World War II. CPI helps explain why the first eight decades of the 20th century have an unusually low return.

In summary, evidence challenges the conventional wisdom that stocks beat bonds over the long run, because bond underperformance derives from an arguably anomalous four (1942-1982) of 22 decades.
Cautions regarding findings include:
- Returns are gross, not net. Any fees involved in buying and selling bonds (or stocks) would reduce returns.
- Economies and markets change over time, making it difficult to assess the relative importance of older versus newer data.