How, and how well, do institutional equity traders manage global stock trading frictions? In the April 2018 draft of their paper entitled “Trading Costs”, Andrea Frazzini, Ronen Israel and Tobias Moskowitz examine the real-world trading frictions of a large trader. They define trading frictions as the difference in results between a theoretical portfolio with zero frictions and a practical tracking portfolio with frictions. They account for all components of trading frictions: broker commissions, bid-ask spreads and price impacts of trading. They record market price at trade initiation, volume traded and execution price for each share traded, as well as type of trade (buy long, buy-to-cover, sell long or sell short). They describe how frictions vary by trade type, stock characteristics, trade size, time and exchange. Based on preliminary findings, they devise and test out-of-sample a price impact model based on market conditions, stock characteristics and trade size calibrated to actual U.S. and international trades. Using $1.7 trillion of orders and trade execution data from a large institutional money manager spanning 21 developed equity markets during August 1998 through June 2016, they find that:
- The manager supplying the source data employs a trading algorithm designed to limit price impact via a series of limit orders that patiently seek to give rather than take liquidity.
- 99.9% of all intended trades execute, with average completion slightly less than a day.
- Actual trading frictions are an order of magnitude lower than suggested in prior studies. Price impact of trading is the dominant component.
- Average effective bid-ask spread across U.S. trades is less than 0.015%.
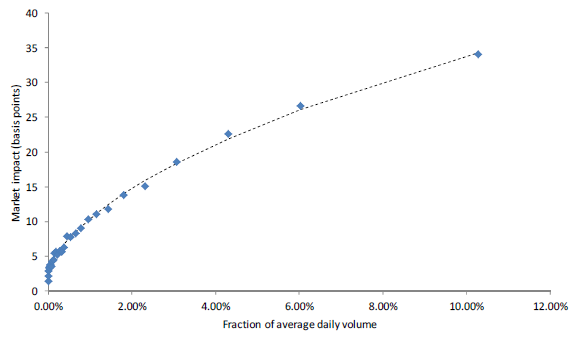
- Price impact increases at a decreasing rate with trade size (see the chart below).
- Across 21 developed markets, price impact declines with the number of available trading venues, but does not vary with transaction taxes or short-sale rules.
- Within markets, price impact exhibits steady decline over the sample period, but rises with market volatility. Frictions relate negatively to stock capitalization and positively to stock idiosyncratic volatility.
- The model calibrated to match actual costs in the sample outperforms other models from prior research in explaining actual costs of index funds.
The following chart, taken from the paper, plots average price impacts of trading across 30 subsamples ranked by fraction of daily volume represented by trades. The resulting best-fit curve is concave, with impact growing significantly with traded fraction of daily volume, but at a decreasing rate.

In summary, evidence indicates that actual institutional stock trading frictions are much lower than widely reported in prior research.
Cautions regarding findings include:
- Many investors may not be able to achieve the indicated level of trading frictions due to less favorable broker fees, trade sizes and/or lack of sophisticated trading algorithm.
- Price impact may not be the dominant component of trading frictions for small traders, especially those trading relatively illiquid stocks.
- Findings may lose efficacy for backtests of data preceding the sample period.