Which short index options offer the best overall performance? In their June 2017 paper entitled “Which Index Options Should You Sell?”, Roni Israelov and Harsha Tummala explore return and risk properties of short delta-hedged out-of-the-money S&P 500 Index put and call options of various moneyness and maturities. They consider moneyness of -2.5 to +1.0 standard deviations relative to the forward index price. They consider maturities of one, two, three, six and 12 months. They assume daily delta-hedge rebalancing with S&P 500 Index futures to isolate volatility and time effects. They calculate average returns and estimate alphas and betas relative to S&P 500 Index returns. They then calculate three beta-adjusted risk metrics for the returns: (1) volatility; (2) stress-test losses (specified for a 20% one-day adverse S&P 500 Index move as on October 19, 1987); and, (3) 0.1% value at risk (VAR), which approximately translates to a once-in-four-years worst loss. Using daily data for S&P 500 Index options with standard monthly expiration dates (3rd Friday of the month) and for the index itself during late March 1996 through December 2015, they find that:
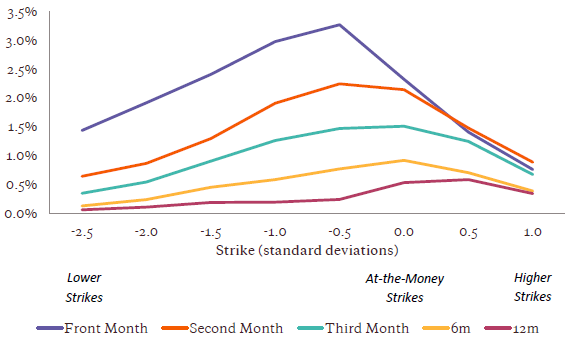
- With respect to delta-hedged gross returns (see the chart below):
- For a given moneyness, shorter-maturity options mostly beat longer-maturity options.
- Near-the-money options beat deep out-of-the-money options due to higher volatility exposure.
- Put options mostly beat comparable call options, likely due to investor demand for protection.
- With respect to delta-hedged gross alphas and betas:
- Equity beta is higher for near-the-money than out-of-the-money options.
- Alphas are are similar to returns, but shifted downward due to removal of volatility-driven equity exposure. The downward shift is larger for near-the-money (higher beta) options than out-of-the-money options.
- With respect to beta-adjusted gross volatilities, stress test losses and VARs:
- Out-of-the-money and longer-maturity options have significantly lower return volatility than their near-the-money and short-maturity counterparts.
- Stress-test losses are lower for near-the-money options than for out-of-the-money options. However, as for volatility, stress-test losses tend to be lower for comparable long-maturity options than short-maturity options.
- VAR findings are more like those of volatility than stress-test loss.
- Findings are generally similar for two equal subperiods.
The following chart, taken from the paper, summarizes average annualized gross delta-hedged returns from selling S&P 500 Index options on expiration dates for eight levels of moneyness (standard deviations) and five maturities, and holding until expiration. In general, average returns are highest for short-maturity, moderately out-of-the-money options.

In summary, evidence indicates that investors most concerned about: (1) return volatility should concentrate on selling nearest-maturity, deep-out-of-the-money puts; or, (2) tail risk should concentrate on selling nearest-month and near-the-money/moderately out-of-the-money options.
Cautions regarding findings include:
- Findings are gross, not net. Accounting for costs of monthly selling of options (bid-ask spreads and broker fees) and daily rebalancing of delta hedges (S&P 500 Index futures transactions) would reduce performance for each group of options. To the extent these costs differ across option maturities and moneyness, net findings would differ from gross findings.
- As noted, the best options to sell for return/alpha depend on whether the seller is most concerned about conventional (volatility) or tail (stress-test) risk.
See also: