Each week the media report U.S. initial and continued unemployment claims (seasonally adjusted) as a potential indicator of future U.S. stock market returns. Do these indicators move the market? To investigate, we focus on weekly changes in unemployment claims during a period of “modern” information dissemination to release-day and next-week stock market returns. By modern period, we mean the history of S&P Depository Receipts (SPY), a proxy for the U.S. stock market. Using relevant news releases and archival data as available from the Department of Labor (DOL) and dividend-adjusted weekly and daily opening and closing levels for SPY during late January 1993 through mid-July 2018 (1,330 weeks), we find that:
Note that:
- DOL generally releases unemployment claim reports on Thursdays before the market open. When Thursday is a holiday (Thanksgiving and sometimes the 4th of July, Christmas and New Year’s Day), they release reports on the preceding Wednesday.
- DOL data include both initial and continued claims in both seasonally adjusted (SA) and non-seasonally adjusted (NSA) forms. We consider all variations, focusing on weekly SA initial claims relative to the prior-week revised SA initial claims, as emphasized in news releases and by the media. On average, weekly revisions increase prior-week SA initial claims by 0.5%.
- The DOL archive of real-time news releases extends back only to mid-October 2002. From a prior iteration of this analysis, we have data from some news releases back to early 1995. There are a few missing releases even in recent data.
- SA data in the DOL archive differ somewhat from both new and revised SA data in news releases due to long-term revisions. The absolute weekly difference averages 2.1%.
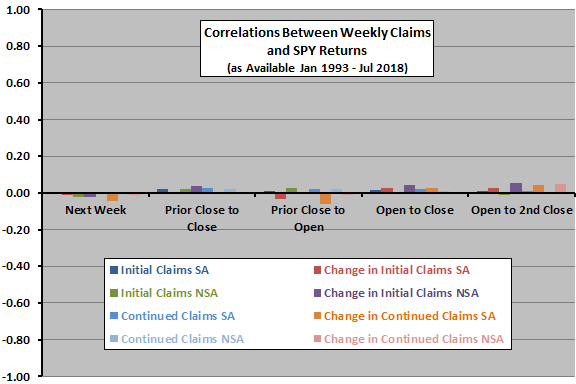
The following chart summarizes correlations between all combinations of weekly levels of and changes in initial and continued, SA and NSA unemployment claims and SPY returns from this week to next week, prior close to release day close, close to release day open, release day open to close and release day open to next close for all release dates in the sample. Correlations are all very small and somewhat erratic with respect to sign across metrics, undermining belief in any reliable relationship.
In case there is a material non-linearity in the relationship, we look at SPY returns by ranked changes in initial SA claims.

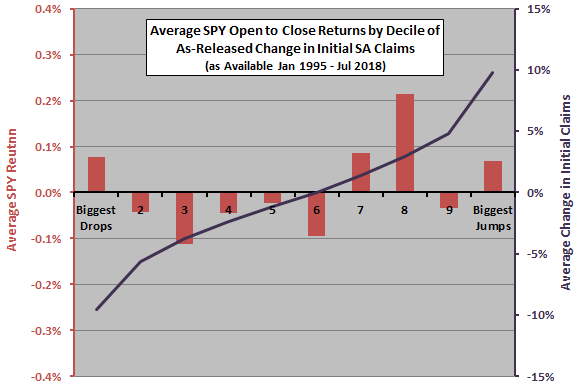
The next chart summarizes average SPY returns (left axis) from release day open to close by ranked tenth (decile) of changes in initial SA unemployment claims relative to the revised number for the prior week from news releases. Over all days during the sample period, average SPY returns for this intervals are slightly positive. The dark line shows the average change in claims for each decile (right axis).
Lack of systematic progressions in average returns across deciles confirms the low correlations reported above and undermines belief in any reliable relationship.

In summary, evidence from simple tests offers little support for belief that weekly reports on initial and continued U.S. unemployment claims exploitably predict U.S. stock market return.
Cautions regarding findings include:
- Analyses in-sample. An investor operating in real time with strictly historical data may reach different conclusions at different points in time.
- Given the weak and inconsistent results, we test no trading strategies.
- This analysis does not rule out the possibility that surprises in initial unemployment claims, relative to some measurable expectation, more usefully forecast release-day stock market returns.
For longer term effects of employment/unemployment on stock market returns, see “Employment and Stocks Over the Intermediate Term” and “Unemployment Rate and Stock Returns”.