Are there economic conditions that favor stock price momentum investing? In the May 2012 draft of their paper entitled “Momentum and Aggregate Default Risk”, Arvind Mahajan, Alex Petkevich and Ralitsa Petkova investigate the relationship between stock momentum portfolio returns and U.S. aggregate default risk. They measure the momentum effect as average monthly gross returns of overlapping hedge portfolios formed each month by buying (selling) the equally weighted tenth of stocks with the highest (lowest) cumulative returns over the past six months and holding for six months, with a skip-month between ranking and holding intervals. They measure aggregate default risk as the prior-month yield spread between the Moody’s CCC corporate bond index and the 10-year U.S. Treasury note. They define default risk shocks as deviations from the linear relationships between default risk this month and its values the prior two months. They define high (low) default risk shock conditions as those above (below) the inception-to-date median value of the series. Using monthly returns for a very broad sample of AMEX/NYSE/NASDAQ stocks during 1960 through 2009 and monthly default risk spreads since 1954, they find that:
- During 1960 through 2009, the average monthly gross return of the winner (loser) sides of momentum portfolios is 1.74% (0.95%), yielding a gross overall momentum effect of 0.79% per month.
- The gross momentum effect is elevated (1.93% per month) during months after high default risk shocks and depressed (-0.64% per month) during months after low default risk shocks.
- Over the National Bureau of Economic Research (NBER)-designated U.S. economic cycle:
- During expansions, the overall gross momentum effect is 0.85% per month, 1.74% per month during months after high default risk shocks and essentially zero during months after low default risk shocks.
- During contractions, the overall gross momentum effect is 0.18% per month, 2.76% per month during months after high default risk shocks and -3.75% during months after low default risk shocks.
- The momentum effect tends to decrease as firm investment grade increases.
- Findings generally hold after controlling for size, book-to-market and industrial production growth factors, and during pre-1960 and post-1995 subperiods when the overall momentum effect is weak.
- Findings extend to UK, German, French and Dutch equity markets based on respective monthly stock returns during 1985 through 2010 and contemporaneous U.S. default risk data. During months after high (low) U.S. default risk shocks, respective gross momentum effects are 2.29%, 1.00%, 1.57% and 2.09% (lower or absent).
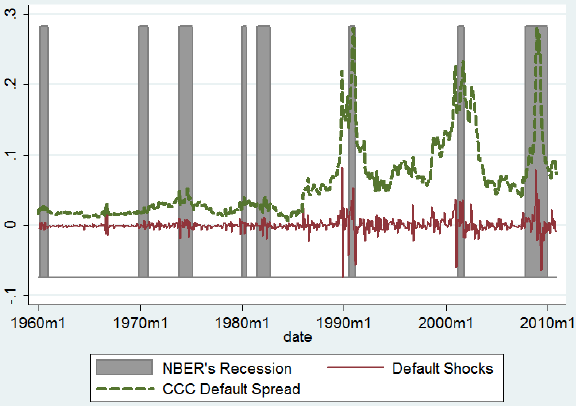
The following chart, taken from the paper, plots U.S. default risk levels (yield spread between Moody’s CCC corporate bond index and 10-year U.S. Treasury note) and shocks since 1960, with shaded intervals corresponding to NBER economic contractions. The correlation between default risk level and economic contractions is about 0.30, but that between default risk shocks and economic contractions is only about 0.05. In other words, default risk shocks define default conditions largely unrelated to general economic state (but, as indicated above, closely related to the stock price momentum effect). Volatility of default risk shocks suggests that modifying a momentum strategy with default risk shock signals may substantially increase portfolio turnover and associated trading frictions.

In summary, evidence indicates that investors may be able to enhance returns from momentum investing in individual stocks by focusing on speculative grade stocks during months following increases in aggregate U.S. default risk.
Cautions regarding findings include:
- Return calculations are gross, not net. Including reasonable trading frictions, which tend to be high for momentum strategies because of high turnover, would reduce reported returns and may affect findings. It is plausible that speculative grade stocks and months after large increases in aggregate default risk relate to relatively high trading frictions.
- Including costs of shorting for hedge portfolios would also reduce reported returns. Shorting may not be feasible for all loser stocks.
- Statistical significance tests assume tame return distributions. Also, there are so many studies on the momentum effect in U.S. stocks over the sample period that aggregate data snooping bias in the research stream is plausible.