Does the ratio of aggregate U.S. stock market valuation (MV) to U.S. Gross National Product (GNP) or Gross Domestic Product (GDP), the approximate value of goods and services produced by U.S. companies, reliably indicate stock market overvaluation? In their July 2015 paper entitled “Can Warren Buffett Also Predict Equity Market Downturns?”, Sebastien Lleo and William Ziemba investigate whether MV/GNP accurately predicts peak-to-trough declines of more than 10% in daily closes of the S&P 500 Total Return Index within a year. They consider: (1) a simple static model based on a 120% overvaluation threshold; and, (2) two dynamic statistical confidence models based on mean and standard deviation during a four-quarter rolling historical window. They consider both MV/GNP and the logarithm of MV/GNP (relating variable changes) as predictive variables. Using quarterly, seasonally-adjusted GNP and Wilshire 5000 Full Capitalization Price Index level as a proxy for MV (the limiting series) and daily level of the S&P 500 Total Return Index from the fourth quarter of 1970 through the first quarter of 2015 (177 quarters), they find that:
- Over the sample period, the ratio of GNP (value of products and services produced by U.S. citizens and companies anywhere) to GDP (value of products and services produced in the U.S.) is in a narrow 1.00 to 1.02 range, suggesting that they are interchangeable.
- Over the sample period, there are 19 stock market declines as specified above, with average magnitude 21% and average duration 197 days.
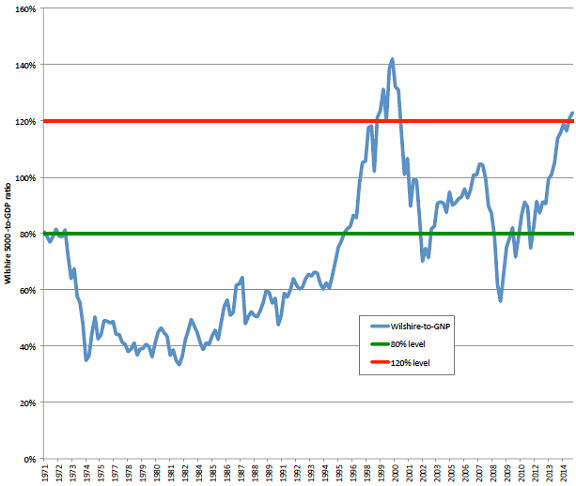
- MV/GNP varies considerably over the sample period and does not appear to have a fixed average value to which it reverts (see the chart below).
- The static MV/GNP valuation model with 120% overvaluation threshold does not work well, generating only two signals. For MV/GNP, one signal is correct. For log(MV/GNP), both signals are correct.
- The dynamic MV/GNP models generate 10 or 11 signals with statistically significant accuracies of about 70%.
The following chart, taken from the paper, shows the ratio of the Wilshire 5000 Full Capitalization Price Index (a proxy for MV) to U.S. GNP. The green (red) lines indicate 80% and 120% levels. MV/GNP has risen above 120% only two times in 45 years, about the ends of 1998 and 2014.
Visual inspection suggests that this series has no average to which it reliably reverts, or that the sample period is to short to reveal it. Extracting a useful signal from the series therefore entails analysis of a rolling historical window (four quarters for the dynamic analyses described above).

In summary, evidence suggests that investors can anticipate sharp declines in the U.S. stock market using a dynamic model based on MV/GNP over a rolling history of four quarters, but not a simple static model based on the ratio over its entire available history.
Cautions regarding findings include:
- Economic series such as GNP often include retroactive adjustments and revisions that may impound look-ahead bias. The authors use such as-revised rather than vintage (as-released) GNP data. Findings based on as-released data may differ.
- The authors do not account for any lag in availability of final GNP data (roughly a quarter), thereby impounding look-ahead bias. Findings based on real-time data may differ.
- The study is academic. The authors do not demonstrate the economic significance of findings with any strategy that exits and re-enters stocks to avoid crashes.
- There may be snooping bias in selecting the rolling historical window length and the statistical confidence thresholds used for dynamic MV/GNP analyses.
- The study does not explore whether the MV series alone (price or return reversion) is as good as MV/GNP in predicting stock market downturns.