A subscriber asked (years ago): “Everyone says I should not invest in bonds today because the interest rate is so low (and inflation is daunting). But real bond returns over the last 30 years are great, even while interest rates are low. Could you analyze why bonds do well after, but not before, 1981?” To investigate, we consider the U.S. long-run interest rate and the U.S. Consumer Price Index (CPI) series from Robert Shiller. The long-run interest rate is the yield on U.S. government bonds, specifically the constant maturity 10-year U.S. Treasury note after 1953. We use the term “T-note” loosely to name the entire series. We apply the formula used by Aswath Damodaran to the yield series to estimate nominal T-note total returns. We use 12-month change in CPI. We subtract inflation from T-note nominal total return to get T-note real total return. Using annual Shiller interest rate and CPI data for 1871 through 2020, we find that:
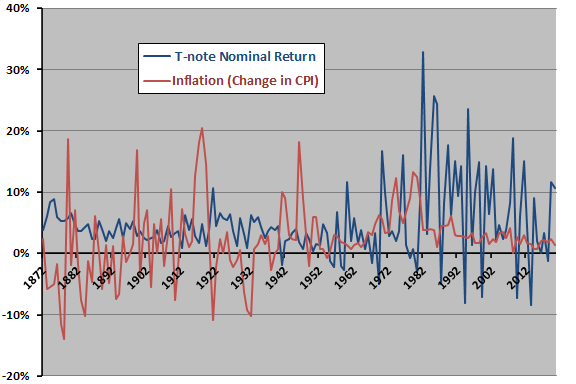
The following chart tracks annual inflation and annual T-note nominal total return over the available sample period. Visual inspection indicates that:
- Inflation volatility is much higher during the first half of the sample than the second half.
- T-note nominal returns are especially strong (and volatile) over the past 50 years.
Data reliability is likely higher in the second half of the sample (more systematic measurements and fewer extrapolations), and this difference may account for some of the observed changes over time.
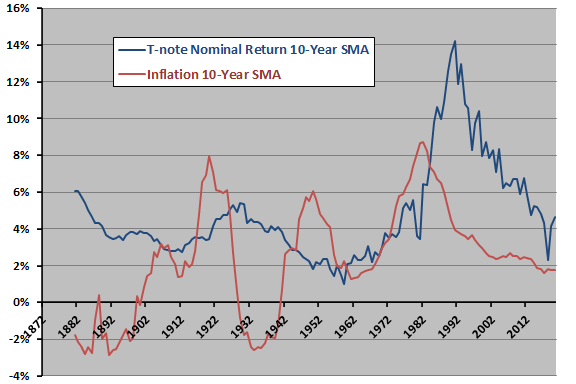
To suppress noise, we compare 10-year simple moving averages (SMA) of these two series.
The next chart tracks 10-year SMAs of annual inflation and T-note annual nominal total return over the available sample period. Notable points are:
- There may be an inflation cycle with period roughly 30 years (but the latest missing).
- Real T-note returns perhaps tend to be weak just preceding and during inflation cycle highs (lows) and strong after these highs.
- The subperiod since 1981 is largely disinflationary.
However, the sample is so small in terms of number of cycles that statistical analysis of cycle characteristics is unreliable.
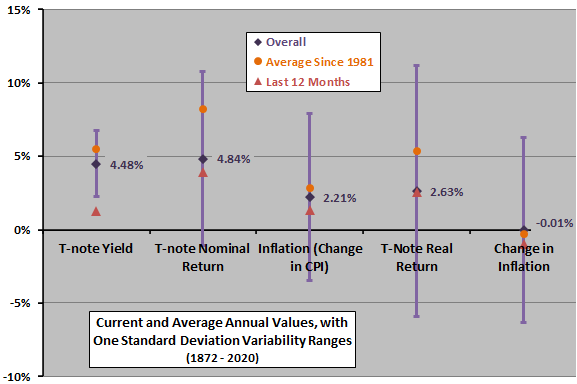
For another perspective, we look at annual statistics.
The next chart summarizes arithmetic annual averages and variability ranges (one standard deviation above and below) for T-note yield/return and inflation metrics over the available sample period. Orange circles indicate averages since 1981. Red triangles indicate values for the last 12 months based on data available through February 2021. Notable points are:
- T-note average annual yields, nominal total returns and real total returns are relatively high since 1981, but average annual inflation is not high.
- The most recent T-note nominal and real returns are mostly a little below full-series averages, but T-note yield is unusually low.
For comparison the geometric average (annually compounded) T-note nominal total return is 4.7% overall and 7.9% since 1981.
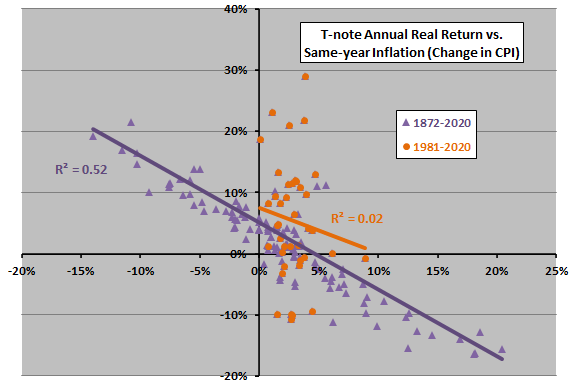
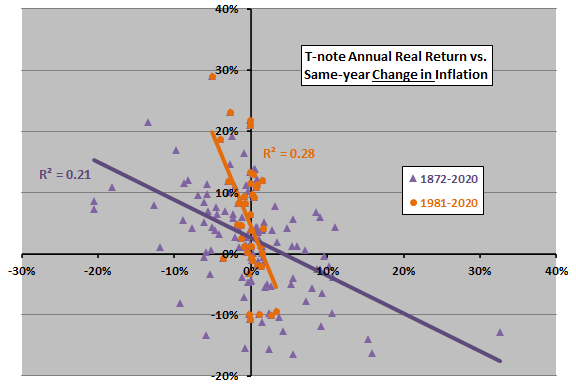
To explore relationships between T-note real return and inflation metrics, we use scatter plots.
The following scatter plot relates annual T-note real total return to same-year inflation (change in CPI) over the available sample period and since 1981. Both slopes are negative, indicating that relatively low (high) inflation tends to be favorable (unfavorable) for T-note real return. Based on R-squared statistics, same-year annual inflation explains 52% (only 2%) of T-note annual real return since 1872 (1981).
Again, data before 1953 are probably less systematically collected and precisely suited to the return estimation methodology.
What about annual change in inflation?
The next scatter plot relates annual T-note real total return to same-year change in inflation over the available sample period and since 1981. Again, both slopes are negative, indicating that drops (jumps) in inflation tend to be favorable (unfavorable) for T-note real return. Based on R-squared statistics, same-year change in inflation explains 21% (28%) of T-note annual real total return since 1872 (1981).
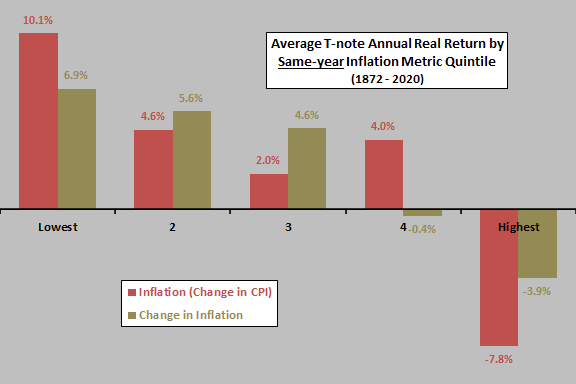
In case there are tail effects, we look at ranges of inflation and change in inflation.
The next chart summarizes average T-note annual real total return by ranked fifth (quintile) of same-year inflation and change in inflation over the available sample period. Contemporaneous relationships are fairly systematic and not dominated by tail effects. Low (high) inflation and decreases (increases) in inflation are good (bad) for contemporaneous real T-note returns. However, there are only 29-30 observations per quintile, so confidence in findings is not high.
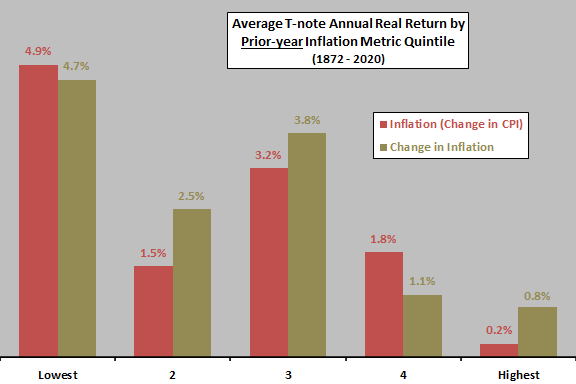
Analyses so far are contemporaneous. Might past inflation and change in inflation predict future T-note real return?
The final chart summarizes average T-note annual real total return by quintile of prior-year inflation and change in inflation over the available sample period. Predictive relationships are not as systematic as the above contemporaneous relationships, but do suggest that low (high) inflation and decreases (increases) in inflation are good (bad) for next-year real T-note returns. In other words, inflation rises and falls slowly across years because annual changes in inflation are persistent.
Again, quintile subsamples (29-30 observations each) are small.
In summary, evidence from simple tests suggests that relatively low (high) inflation and decreases (increases) in inflation are good (bad) for future real T-note returns.
Results also suggest that backtests involving bonds over the past five decades may not be representative of the longer term.
Cautions regarding findings include:
- As noted, Shiller data before 1953 are probably less systematically collected and less precisely suited to the T-note return estimation methodology.
- Changes in economic/monetary policies may make current data incomparable to older data.
- The Shiller interest rate series uses the average daily yield during each month to calculate the yield for that month. This approach blurs the time series, but is not particularly misleading as used above.
- As noted, there are very few inflation cycles/investor generations in the sample period.
- Normal interpretations of the statistics used assume tame return distributions. To the extent the actual distributions are wild (perhaps as driven by major wars), these interpretations lose meaning.
See “Triumph of the Optimists (Chapter-by-Chapter Review)”, Chapter 6, for a global view of bond returns.