Financial media often cite Bureau of Labor Statistics (BLS) productivity growth news releases as relevant to investment outlook. Does the quarter-to-quarter change in U.S. labor force productivity predict U.S. stock market behavior? Specifically, does a relatively weak (strong) change in productivity portend strong (weak) earnings and therefore an advance (decline) for stocks? Using annualized quarterly changes in non-farm labor productivity from BLS and end-of quarter S&P 500 Index levels during January 1950 through March 2019, we find that:
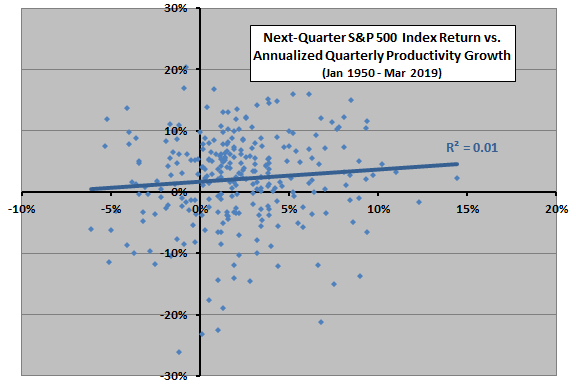
The following scatter plot relates next-quarter S&P 500 Index return to quarterly productivity growth over the full sample period. The Pearson correlation for the relationship is 0.09 and the R-squared statistic is 0.01, indicating that variations in productivity growth explain only 1% of the variation in next-quarter stock market return. Moreover, BLS announcements of productivity growth occur about a month after the end of the quarter reported.
For the first half of the sample (through 1984), the correlation is 0.02. For the second half of the sample, the correlation is 0.00.
Might there be a delayed effect of productivity growth on stock market return?

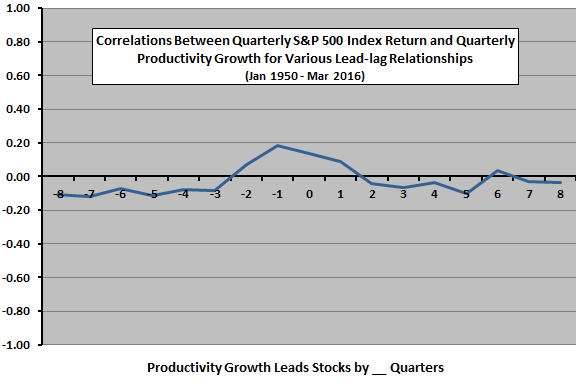
The next chart summarizes relationships between S&P 500 Index quarterly return and quarterly productivity growth for various lead-lag scenarios, ranging from stock market return leads productivity growth by eight quarters (-8) to productivity growth leads stock market return by eight quarters (8) for the full sample period. The strongest indication (correlation 0.18) is that stock market return leads productivity growth positively by one quarter. In other words, stock market returns are relatively strong (week) before relatively strong (weak) productivity growth. Productivity growth may weakly lead the stock market by one quarter, but the effect does not persist into subsequent quarters.
In case there are material non-linearities in the relationship, we look at stock market behavior by range of productivity growth.

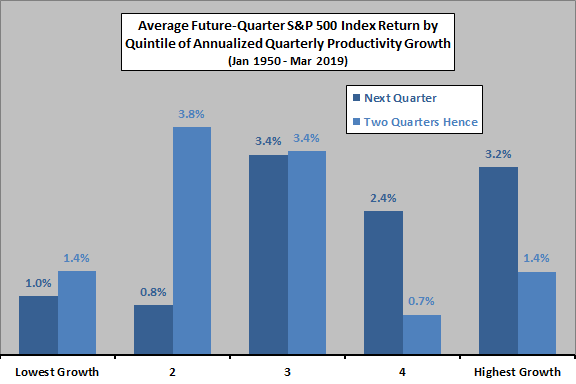
The next chart summarizes average S&P 500 Index return next quarter and two quarters hence by ranked fifth (quintile) of quarterly productivity growth over the entire sample period. There are 55 observations per quintile. Neither future return series exhibits systematic progression across productivity growth quintiles. There is some indication that weak productivity growth is worse than average and strong growth for next-quarter stock market return, but not for return the following quarter.
Do productivity growth series revisions affect interpretation of results?

BLS states: “Generally, a recent quarter of data is revised two or three times after its initial release. Historical revisions occur when the source data used in their construction are revised. Because many of these sources are revised independently, the productivity measures undergo frequent revision.”
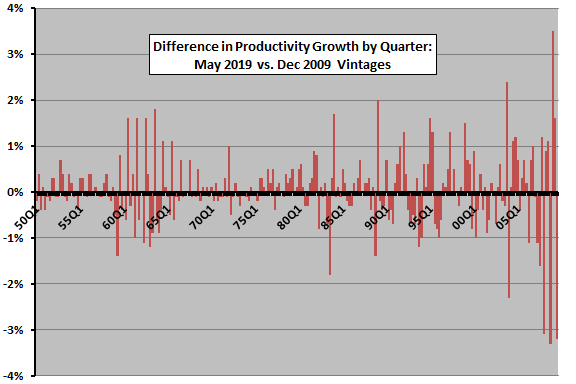
The final chart shows differences in quarterly productivity growth during January 1950 through September 2009 for two vintages of BLS historical data: December 2009 and May 2019. Revisions are extensive, with changes for 90% of quarters reported. Revisions at the end of the period during the financial crisis and initial recovery are pronounced.
In other words, the historical series likely deviates considerably from as-released data. Deviations may be especially large during times of financial market turmoil.

In summary, evidence from simple tests indicates that quarterly U.S. labor productivity growth as available from BLS is likely not useful for predicting U.S. stock market behavior, and perhaps that investors should not consider it due to large cumulative revisions.
Cautions regarding findings include:
- Productivity calculations employ other economic data series and do not capture the entire U.S. economy. Productivity growth may be therefore inherently less useful than economic series such as Gross Domestic Product and employment.
- Extensive revisions in productivity growth over time indicate the possibility of data snooping bias in current “historical” datasets.
- Differences between as-released productivity growth and some contemporaneous measure of expectations may evoke a short-term stock market reaction.