A subscriber suggested the Kansas City Financial Stress Index (KCFSI) as a potential U.S. stock market return predictor. This index “is a monthly measure of stress in the U.S. financial system based on 11 financial market variables. A positive value indicates that financial stress is above the long-run average, while a negative value signifies that financial stress is below the long-run average. Another useful way to assess the current level of financial stress is to compare the index to its value during past, widely recognized episodes of financial stress.” The paper “Financial Stress: What Is It, How Can It Be Measured, and Why Does It Matter?” describes the 11 financial inputs for KCFSI and its methodology, which involves monthly demeaning of inputs, monthly normalization of the overall indicator to have historical standard deviation one and principal component analysis. This process changes past values in the series, perhaps even changing their signs. Is KCFSI useful for U.S. stock market investors? To investigate, we relate monthly S&P 500 Index returns to monthly values of, and changes in, KCFSI. We match return calculation intervals to KCFSI release dates. Using monthly data for KCFSI and the S&P 500 Index during February 1990 (limited by KCFSI) through March 2021, we find that:
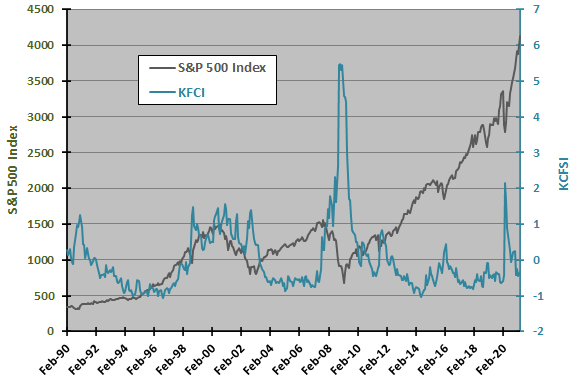
The following chart tracks monthly levels of the S&P 500 Index and KCFSI over the available sample period. Visual inspection suggests a negative relationship between the two series, accentuated when KCFSI spikes, but it is not obvious whether one series leads the other.
As noted, cumulative effects of monthly demeanings/renormalizations can be large, undermining use of the KCFSI series for backtesting. However, they should have little effects on past monthly changes in KCFSI, so we focus on relating monthly changes in KCFSI to future monthly stock market returns.

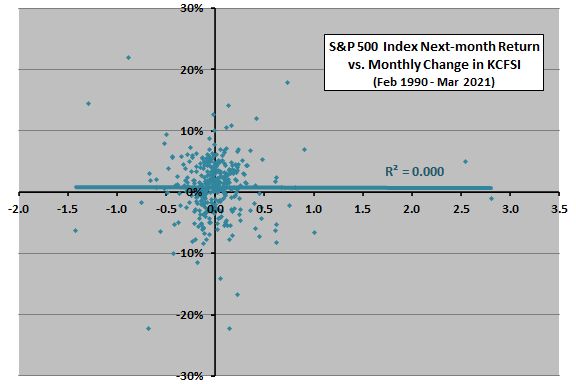
The following scatter plot relates S&P 500 Index next-month return to monthly change in KCFSI over the available sample period. The Pearson correlation for the two series is 0.00 and the R-squared statistic accordingly 0.000, indicating that change in KCFSI explains none of the variation in next-month stock market returns. R-squared between S&P 500 Index next-month return and monthly change in KCFSI is 0.028 (0.005) over the first (second) half of the sample, with break point August 2005.
Results do not support belief that monthly change in KCFSI predicts stock market return. However, in case there is a useful non-linearity, we look at ranges of monthly changes in KCFSI.

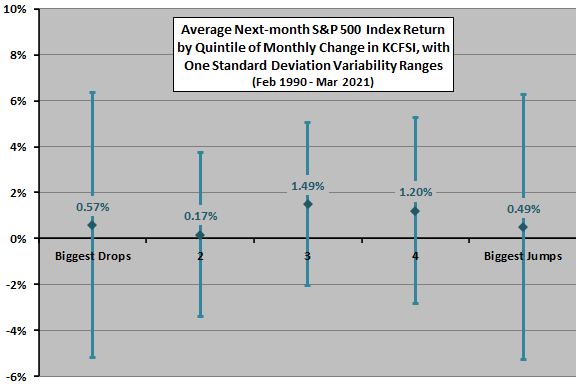
The next chart shows average next-month S&P 500 Index returns across ranked fifths (quintiles) of monthly changes in KCFSI over the full sample period (74-75 observations per quintile). Notable points are:
- Overall, increases in KCFSI (financial stress) may be better for stocks than decreases. However, average returns do not not vary systematically across quintiles.
- Variability of quintile returns is highest in extreme quintiles.
- Average next-month S&P 500 Index return when stress decreases (increases) is 0.57% (0.89%).
- Average next-month S&P 500 Index return for the 10 biggest drops (jumps) in KCFSI is 0.72% (1.55%).
Findings are conflicting and sometimes counter-intuitive.
Might KCFSI be a better predictor at horizons longer than one month?

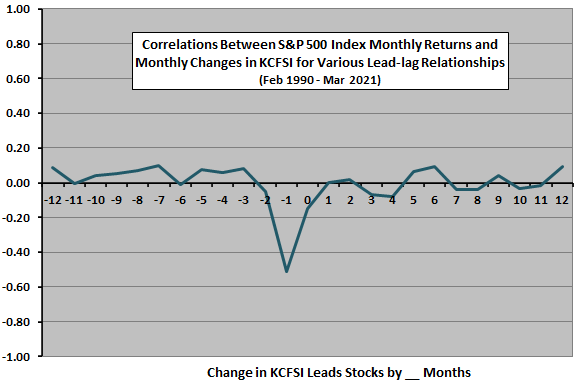
The final chart summarizes correlations for various lead-lag relationships between monthly change in KCFSI and monthly S&P 500 Index return over the full sample period, ranging from stock market return leads monthly change in KCFSI by 12 months (-12) to monthly change in KCFSI leads stock market return by 12 months (12). Results indicate that:
- Stock market return leads change in KCFSI by one month strongly and negatively. In other words, a strong (weak) stock market return predicts a decrease (increase) in KCFSI next month.
- All other lead-lag relationships are weak and appear to be noise.

In summary, evidence from simple tests on available data offers little support for belief that KCFSI is a useful predictor of U.S. stock market returns.
Cautions regarding findings include:
- The sample is small in terms of number of economic cycles and bull/bear markets, such that (as suggested by the first chart) peculiarities of the 2008-2009 financial crisis and market crash may dominate findings.
- Analyses are in-sample. An investor operating in real time may draw different conclusions at different points during the sample period.
- As noted, monthly demeanings/renormalizations of KCFSI and its inputs alter past values and undermines its direct use for backtesting.
- KCFSI did not exist during most of the sample period (data are backfilled), raising suspicion of data snooping bias regarding pre-2009 data. Also, there is no feedback from the market before its publication in 2009.