A subscriber asked about the validity of the assertion in “The Daily Shot” of February 26, 2019 (The Wall Street Journal) that “recent weakness in the ISM [Institute for Supply Management] Manufacturing PMI [Purchasing Managers’ Index] index points to downside risks for high-yield debt.” Such a relationship might support a strategy of switching between high-yield bonds and cash, or high-yield bonds and U.S. Treasuries, based on PMI data. To investigate, we consider the following two pairs of funds:
- Vanguard High-Yield Corporate (VWEHX) and Vanguard Long-Term Treasury (VUSTX) since May 1986 (limited by VUSTX).
- iShares iBoxx High Yield Corp Bond (HYG) and iShares 7-10 Year Treasury Bond (IEF) since April 2007 (limited by HYG).
We consider both statistical tests and strategies that each month (per the PMI release frequency) holds high-yield bonds or cash, or high-yield bonds or Treasuries, according to whether the prior-month change in PMI is positive or negative. We use the 3-month U.S. Treasury bill (T-bill) yield as a proxy for return on cash. Using fund monthly total returns as available and monthly seasonally adjusted PMI data for January 1950 through January 2016 from the Federal Reserve Bank of St. Louis (discontinued and removed) and from press releases thereafter, all through February 2019, we find that:
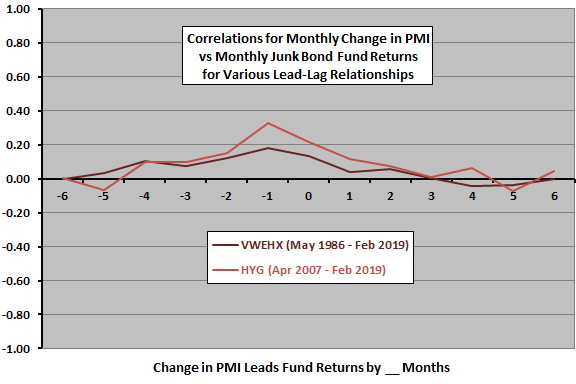
The following chart summarizes correlations between monthly change in PMI and monthly VWEHX/HYG returns for various lead-lag relationships, ranging from fund returns lead change in PMI by six months (-6) to change in PMI leads fund returns by six months (6). Readings for 0 are (unexploitably) coincident. Results suggest that:
- The strongest indication is that fund returns lead change in PMI by one month. The coincident relationship is next strongest. There are weaker indications that fund returns lead change in PMI by two to four months.
- There are weak indications that change in PMI leads fund returns by one to two months, but perhaps not above noise level. The next-month indication is stronger for HYG than VWEHX.
Might there be more exploitable tail effects?

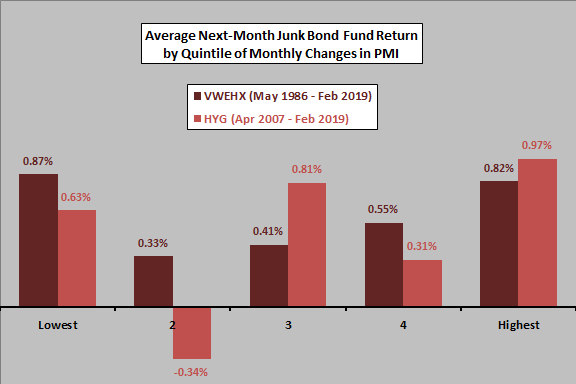
The next chart summarizes average next-month returns for VWEHX/HYG by ranked fifth (quintile) of monthly changes in PMI. Findings do not support belief that PMI behavior predicts fund returns at a 1-month horizon. Returns do not rise or fall systematically across quintiles, and returns for the quintile of the largest monthly drops in PMI are relatively strong.
How do the junk bond fund timing strategies specified above perform?

The following table summarizes sample lengths and gross performance statistics for the junk bond fund-cash and junk bond fund-Treasuries fund timing strategies based on the sign of last-month change in PMI. Performance statistics are: average monthly gross return; standard deviation of monthly returns; monthly gross reward/risk (average return divided by standard deviation); compound annual growth rate (CAGR); and, maximum drawdown (MaxDD). The table includes buy-and-hold statistics for junk bond and Treasuries funds and correlations of monthly returns between pairs.
For the relatively long VWEHX sample:
- VWEHX-cash offers materially higher monthly reward/risk, lower volatility and shallower drawdown than VWEHX, but also materially lower average monthly return and CAGR.
- VWEHX-VUSTX is mostly unattractive compared to VWEHX.
- Note that VUSTX consists of long-term Treasuries (holding bonds of much longer durations than those in VWEHX), so that its relatively high return and volatility relate to duration risk rather than credit risk.
For the relatively short HYG sample:
- HYG-cash offers materially higher monthly reward/risk, lower volatility and shallower drawdown compared to HYG, but also materially lower average monthly return and CAGR.
- HYG-IEF is not very attractive compared to HYG.
- Note that IEF holdings have somewhat longer durations than HYG holdings, with again some conflation of duration and credit risks.

In summary, evidence from statistical tests and strategy horse races offers little support for the assertion that ISM PMI predicts U.S. junk bond returns.
Cautions regarding findings include:
- As noted, performance statistics are gross, not net. Accounting for switching friction within junk bond timing strategies would reduce their returns.
- PMI releases for a month generally occur during the first few days of the next month, so there is a small mismatch above in calculating monthly changes in PMI and monthly junk bond fund returns. Precise matching of PMI releases and fund returns may affect returns of timing strategies.
- Timely switching between mutual funds is problematic due to return calculation and execution delays. Accounting for these delays may affect returns of mutual fund timing strategies.
- As noted, junk bond fund-Treasuries fund strategy tests involve duration mismatches.