A reader noted and asked: “In a recent article at MarketWatch, Michael Kahn claims that utilities have bond-like sensitivity to interest rates, with the advice that ‘cutting back on exposure to utilities…makes sense, despite their high dividend payouts.’ Do you agree?” To check, we consider the Utilities Select Sector SPDR (XLU) as a proxy for utilities and both 10-year Treasury note (T-note) and 13-week Treasury bill (T-bill) yields as proxies for long-term and short-term interest rates, respectively. Using weekly, monthly and quarterly closing levels of dividend-adjusted XLU, dividend-adjusted S&P 500 SPDR (SPY), T-note yield and T-bill yield over the period December 1998 (limited by XLU inception) through March 2010, we find that:
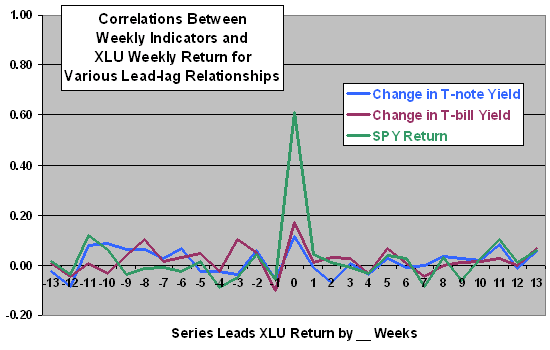
The following chart plots the correlations over the entire sample period (589 weeks) between weekly changes in T-note and T-bill yields and weekly XLU returns for lead-lag relationships ranging from XLU returns lead yield changes by 13 weeks (-13) to yield changes lead XLU returns by 13 weeks (13). The chart includes correlations between SPY and XLU returns for comparison.
Results indicate that, using weekly data, XLU behaves largely like common stocks. Lead-lag relationships look like noise.
Might yield-XLU relationships be different for monthly data?

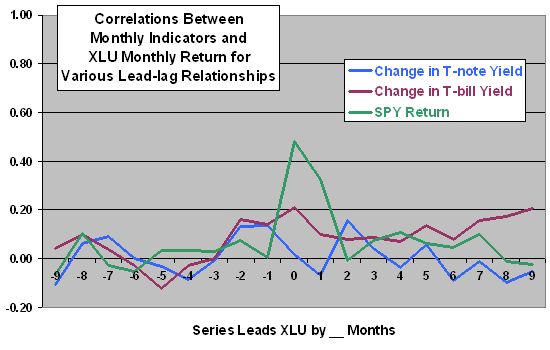
The next chart plots the correlations over the entire sample period (136 months) between monthly changes in T-note and T-bill yields and monthly XLU returns for lead-lag relationships ranging from XLU returns lead yield changes by nine months (-9) to yield changes lead XLU returns by nine months (9). Again, the chart includes correlations between SPY and XLU returns for comparison.
Results indicate that XLU is generally stock-like using monthly data. As previously found in “Do Any Sector ETFs Reliably Lead or Lag the Market?”, there is some tendency for SPY to lead XLU by a month.
There is some indication that changes in T-bill yields may relate positively to future XLU total returns over horizons of months.
Might yield-XLU relationships be stronger for quarterly data?

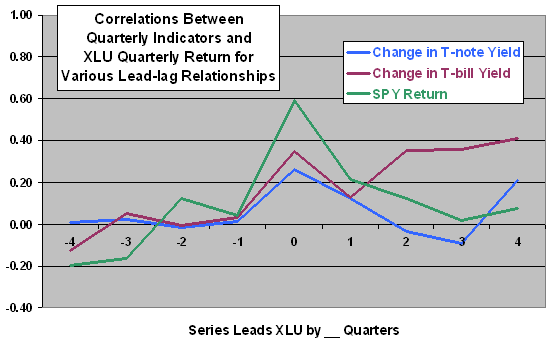
The next chart plots the correlations over the entire sample period (46 quarters) between quarterly changes in T-note and T-bill yields and quarterly XLU returns for lead-lag relationships ranging from XLU returns lead yield changes by four quarters (-4) to yield changes lead XLU returns by four quarters (4). Again, the chart includes correlations between SPY and XLU returns for comparison.
Using quarterly data, results suggest that XLU relates to both stock returns and changes in interest rates. The indication that changes in T-bill yields may be positively related to XLU returns in months ahead is stronger than above.
Is the period over which XLU has existed unusual? Would a series of longer duration produce different results?

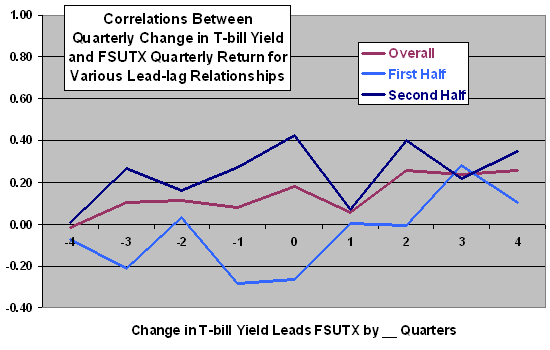
Interest rate cycles generally relate to business cycles, and XLU has not existed for many business cycles. The final chart plots the correlations between quarterly changes in T-bill yields and quarterly Fidelity Select Utilities Portfolio (FSUTX) returns for lead-lag relationships ranging from FSUTX returns lead yield changes by four quarters (-4) to yield changes lead FSUTX returns by four quarters (4) over the period June 1985 (initial availability of prices for FSUTX) through March 2010 (100 quarters).
For comparison, it includes the same correlations for two equal subperiods (break point in late 1997).
The correlation profile for FSUTX for the overall sample is similar to (but weaker than) that for T-bill yields versus XLU returns above, but the subperiod results are quite different, undermining belief in a reliable relationship.

Data snooping bias is a concern when testing multiple rules (here, different measurement intervals) over the same or similar datasets, such that results for the “winning” rule likely overstate the strength of relationship.
In summary, evidence from several simple tests does not support a belief that increases in interest rates reliably predict low returns for utilities based on horizons of a few weeks, months or quarters. If anything, results suggest that increases in short term rates might relate to good returns for utilities some months hence.
Results for a longer sample and longer (closer to business cycle length) measurement intervals may be different.