Does political drama take over as the principal driver of U.S. stock market implied volatility during election seasons? In their March 2012 paper entitled “U.S. Presidential Elections and Implied Volatility: The Role of Political Uncertainty”, John Goodell and Sami Vähämaa compare the effects of political uncertainty to those of eight other sources of uncertainty on implied stock market volatility (as measured by VIX) during U.S. presidential election campaigns. They define the quadrennial campaign interval as the time from the beginning of February to the beginning of November of election years. They consider two measures of political uncertainty derived from the Iowa Electronic Markets: monthly change in probability of success of the eventual winner; and, monthly change in a measure of how close the race is. They also consider eight competing financial and economic sources of uncertainty as listed below. Using monthly data for these ten variables during the presidential election campaigns of 1992, 1996, 2000, 2004 and 2008 (40 total monthly observations), they find that:
- VIX tends to increase (decrease) as the probable winner of the presidential election becomes less (more) certain.
- During presidential campaigns, VIX changes have a significant negative relationship with same-month changes in aggregate corporate earnings and a significant positive relationship with the number of next-month Federal Reserve monetary policy meetings.
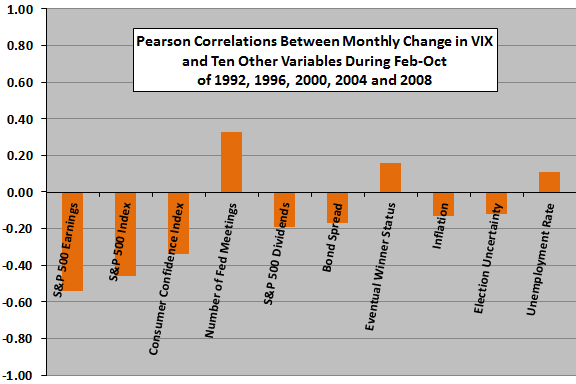
- Political uncertainty does not play a dominant role in driving VIX changes (see the chart below).
The following chart, constructed from data in the paper, summarizes the Pearson correlations in order of magnitude between monthly percentage change in VIX and:
- Same-month percentage change in the S&P 500 Index aggregate earnings.
- Same-month percentage change in the S&P 500 index.
- Same-month percentage change in Consumer Confidence Index.
- Number of the Federal Reserve monetary policy meetings the next month.
- Same-month percentage change in S&P 500 dividends.
- Same-month change in the spread between Moody’s AAA and Baa bond yields.
- Same-month change in the probability of success of the eventual winning candidate.
- Same-month change in inflation.
- Same-month change in election uncertainty (how close the race is).
- Same-month change in the unemployment rate.
Results indicate that election uncertainty is a relatively minor driver of changes in VIX during presidential campaigns.

In summary, evidence from five presidential election campaigns suggests that changes in uncertainty about who will win have some (but not a dominant) effect on changes in VIX; more (less) uncertainty means a higher (lower) VIX.
Cautions regarding findings:
- The sample is very small in terms of number of presidential campaigns. Some elections may be more important to investors than others.
- All relationships examined except that involving number of Federal Reserve meetings are coincident rather than predictive. Moreover, several are known only with delay after the end of the month measured. Exploitability is thus not evident.