Do economic announcements systematically remove uncertainty from financial markets and thus reliably lower implied volatility indexes? In their September 2010 paper entitled “The Impact of Macroeconomic Announcements on Implied Volatilities”, Roland Füss, Ferdinand Mager and Lu Zhao measure the reactions of the Chicago Board Options Exchange Volatility Index (VIX) and the DAX Volatility Index (VDAX) to U.S. and German macroeconomic announcements. They consider announcements of Gross Domestic Product (GDP), the Producer Price Index (PPI) and the Consumer Price Index (CPI). The measurement interval is apparently close-to-close from the day before to the day of announcement. Using monthly/quarterly macroeconomic announcement dates from January 2005 through December 2009 and contemporaneous daily data for VIX and VDAX (60 months), they find that:
- The average daily changes in VIX and VDAX are roughly zero over all days in the sample period.
- VIX declines by an average 1.8% (1.2%) on U.S. (German) PPI announcement dates.
- VDAX declines by an average 1.2%–1.5% on U.S. GDP and CPI and German GDP and PPI announcement dates.
- During the second half of the sample period (the financial crisis), VIX drops an average of more than 2% on U.S. CPI announcement dates, and VDAX drops an average of almost 3% on German GDP announcement dates.
Because the sample period for this study is relatively short and the results somewhat inconsistent, we extend it for U.S. data only, as follows:
- Close-to-close behavior of VIX on monthly GDP announcement dates (advance, preliminary and final) for August 1996 through March 2012.
- Close-to-close behavior of VIX on monthly Employment Situation announcement dates for January 1994 through April 2012.
- Close-to-close behavior of VIX on monthly CPI announcement dates for January 1994 through April 2012
- Close-to-close behavior of VIX on monthly PPI announcement dates for January 1994 through April 2012
- Close-to-close behavior of VIX on FOMC meeting minutes release dates for February 2005 through April 2012
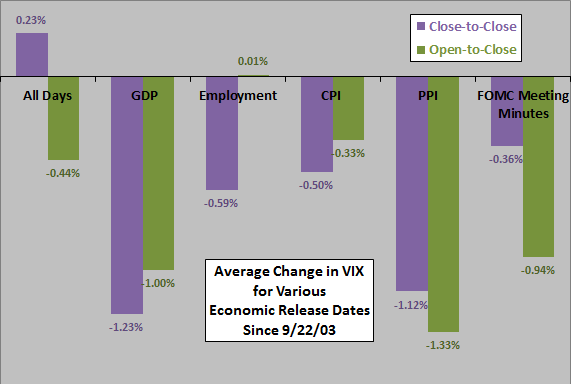
- Open-to-close behavior of VIX for all five sets of announcement dates since 9/22/03 (when opening levels of VIX become available).
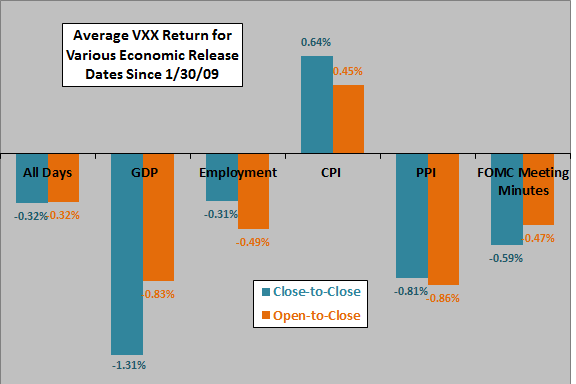
- Close-to-close and open-to-close behavior of the tradable iPath S&P 500 VIX Short-Term Futures ETN (VXX) for all five sets of announcement dates since inception on 1/30/09.
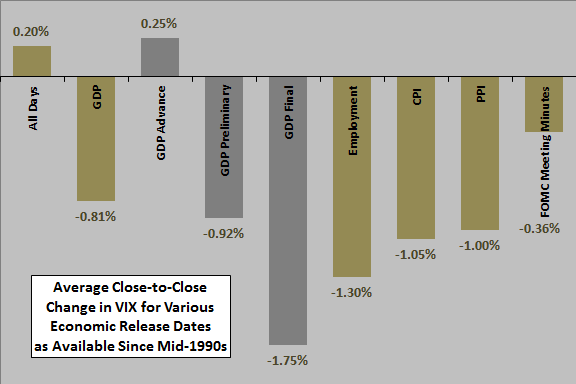
The following chart summarizes average changes in VIX from the close the day before to the close on announcement days (close-to-close) for the selected economic indicators. Results suggest that indicator release does provide relief from uncertainty and thereby make VIX decline. A breakdown of the GDP effect suggests that investors do not take the advance indication seriously.
Does it matter whether the release is good or bad news?
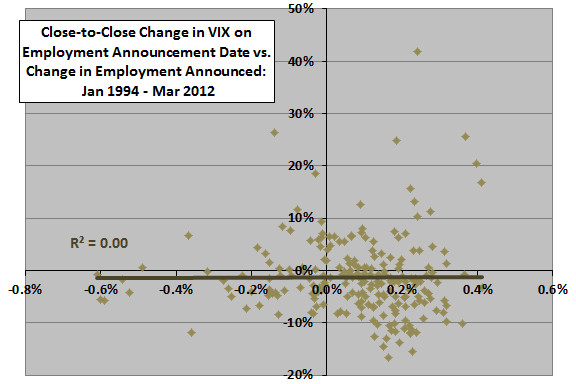
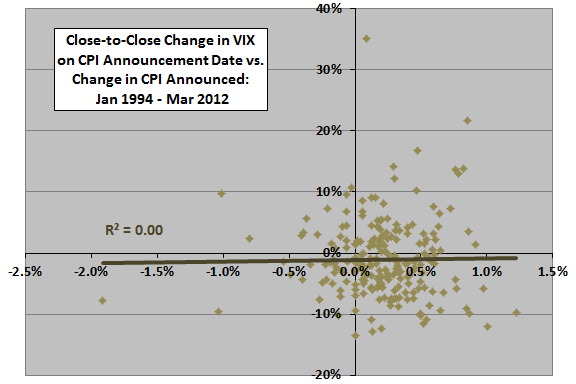
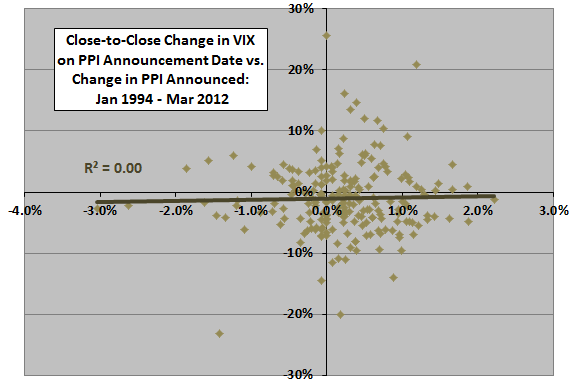
The following three scatter plots relate the close-to-close change in VIX to the change in employment (upper plot), the change in CPI (middle plot) and the change in PPI (lower plot) on the respective announcement dates since 1994. The R-squared statistic for all three pairs of series is 0.00, indicating no relationships.
In other words, the average declines in VIX on employment, CPI and PPI announcement dates are likely general uncertainty relief, independent of whether the announcements convey good or bad news about these indicators.
Does the decline in VIX derive from overnight anticipation or post-announcement (trading hours) response?
The next chart summarizes average close-to-close and open-to-close changes in VIX for the selected economic indicators on announcement days since 9/22/03. Results are mixed whether uncertainty relief is more reliable and material for close-to-close changes than open-to-close changes.
How might these effects translate to a tradable asset?
The final chart summarizes average open-to-close and close-to-close changes in VXX for the selected economic indicators on announcement days since 1/30/09. Results are somewhat inconsistent across economic releases, mostly muted compared to changes in VIX above and mixed regarding close-to-close versus open-to-close trading.
VXX sample sizes is very small (only 26 to 39 observations per economic release).
In summary, evidence from simple tests is mixed regarding exploitability of relief from uncertainty that accompanies release of macroeconomic indicators, as reflected in declines of implied volatility.
Reservations about this conclusion include:
- Testing of different indicators and different subsamples for the same data set introduces data snooping bias, such that the best results likely overstate reasonable expectations.
- VIX and VXX return distributions may be substantially non-normal, such that the average return is not reliably representative of expectations.
- Analyses ignore trading frictions, which would reduce the gross returns reported above.
- As noted above, sample sizes for VXX results are small.