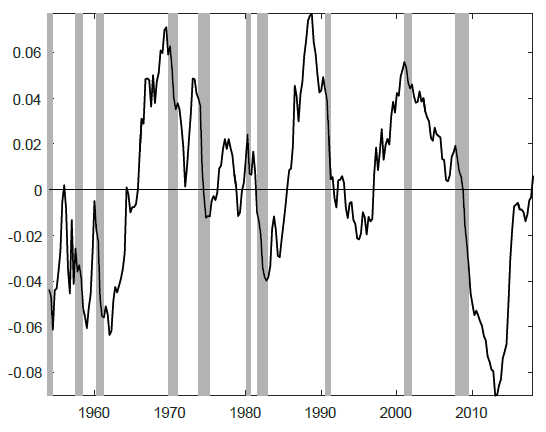
Do investors drive stocks to overvaluation (undervaluation) in good (bad) economic times, such that corresponding expectations for future returns are therefore relatively low (high). In the August 2019 update of their paper entitled “Consumption Fluctuations and Expected Returns”, flagged by a subscriber, Victoria Atanasov, Stig Møller and Richard Priestley introduce the cyclical consumption economic variable and examine its power to predict stock market returns. They hypothesize that in good (bad) economic times:
- Marginal utility of present consumption is low (high).
- Investors are willing (unwilling) to sacrifice current consumption for investment.
- This investment pushes stock prices up (down) and expected returns therefore down (up).
Their principal measure of consumption is quarterly seasonally adjusted real per capita consumption expenditures on non-durables and services from the National Income and Product Accounts (NIPA) Table 7.1 maintained by the U.S. Bureau of Economic Analysis. They extract its cyclical component (detrend) by regressing the logarithm of real per capita consumption on a constant and four lagged values of consumption from about six years prior. They conduct both in-sample and out-of-sample (expanding window regressions, with 2-quarter lag for release delay) tests of the quarterly relationship between cyclical consumption and future U.S. stock market returns. Using the specified consumption data and quarterly returns for the S&P 500 Index and the broad value-weighted U.S. stock market from the first quarter of 1947 through the fourth quarter of 2017, they find that:
- Based on in-sample testing (full sample regression, as in the chart below):
- Overall, a one standard deviation drop in cyclical consumption indicates a 6.5% increase in annualized expected stock market excess return (relative to U.S. Treasury bill yield).
- Predictive power holds during both good and bad (NBER contractions) economic times. A one standard deviation drop in cyclical consumption during bad (good) times indicates a 12% (5%) increase in annualized stock market excess return. Findings are robust to other definitions of bad times.
- Predictive power is somewhat stronger for real stock market return than for nominal return.
- Findings generally hold for 1980-2017, 1990-2017 and 2000-2017 subsamples.
- Based on out-of-sample testing (expanding window, or inception-to-date, regressions):
- Change in cyclical consumption consistently exhibits statistically significant power to predict stock market return, compared to the historical average return, whether forecasts start in 1980, 1990 or 2000.
- However, out-of-sample predictive power is generally weaker than that for in-sample tests.
- For forecast horizons up to three years, cyclical consumption is a more powerful predictor of stock market return than 19 other widely cited economic predictors. For horizons of four and five years, it takes second place.
- Cyclical consumption works also for U.S. industry portfolios and, when using international regional or worldwide measures of consumption, for regional and global stock market indexes.
- Theoretical explanations of asset prices based on consumption habit formation reinforce findings.
The following chart, taken from the paper, plots cyclical consumption as specified above, along with NBER economic contractions as shaded bars, from the fourth quarter of 1953 through the fourth quarter of 2017. By construction, the series average is zero. The standard deviation is 3.74%. One-step autocorrelation is 0.97, corresponding to a half-life of slightly over five years. This variable typically falls throughout economic contractions, rises after contractions and begins falling before the beginning of the next contraction.
In summary, evidence indicates that increases (decreases) in cyclical consumption as specified predict a decrease (increase) in expected stock market returns.
Cautions regarding findings include:
- Testing is statistical only. The authors do not test any market timing strategy, which would require choosing parameters out-of-sample to guide translation of changes in cyclical consumption to tactical portfolio reallocations. Such reallocations would entail frictions that work against predictive power.
- Effects on expected return alone are insufficient to assess investment value. For example, a market timing strategy based on cyclical consumption may bear large drawdowns due to the delay in consumption data availability.
- Findings may impound both inherited (in model development) and direct (in parameter value selection) data snooping bias, such that results overstate expected predictive power.
- Methods described are beyond the reach of most investors, who would bear fees for delegating to an investment/fund manager.
See also “Personal Consumption Expenditures and the Stock Market” and “GDP Growth and Stock Market Returns”, the latter of which looks separately at the lead-lag relationship between the Personal Consumption Expenditures component of U.S. Gross Domestic Product (GDP) and stock market returns.