Does the claim that “credit anticipates and equity confirms” support a trading strategy? In his June 2011 paper entitled “Credit-Informed Tactical Asset Allocation”, David Klein tests a stocks-cash allocation strategy that derives signals from relative valuation of the Bank of America/Merrill Lynch High Yield B index (converted to a default probability) and the Russell 2000 Index (with dividends). The basic premises for the strategy are: (1) stock prices tend to fall when credit spreads rise; and, (2) small capitalization stocks are more sensitive to the credit cycle than large capitalization stocks. The execution of the strategy is to hold stocks (short-term Treasuries) when stocks appear undervalued (overvalued) relative to corporate bonds based on data from a rolling six-month historical interval. Using daily data for the two indexes during May 1997 through April 2011, he finds that:
- Over the test period, the strategy applied to the Russell 2000 Index outperforms buy-and-hold by an annual arithmetic average of 8.8% (16.1% versus 7.3%), with lower volatility (17.5% standard deviation of annual returns versus 24.9%). Annual geometric average outperformance is 7.7%.
- Linear regressions indicate that the strategy captures 65% of monthly Russell 2000 Index advances, but bears only 21% of monthly declines.
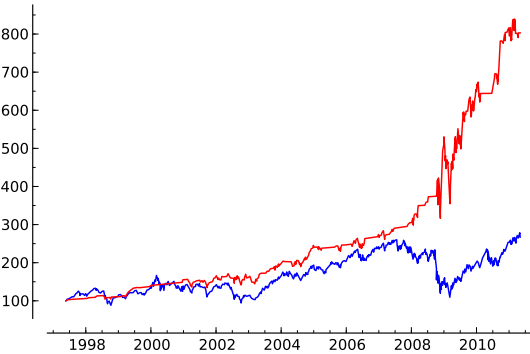
- A $100 initial investment in the strategy in May 1997 grows to over $800 by early May 2011, compared to about $270 for buying and holding the Russell 2000 Index (see the chart below).
The following chart, taken from the paper, compares the cumulative values of $100 initial investments in the credit-signaled strategy applied to the Russell 2000 Index (red line) and buying and holding the Russell 2000 Index (blue line) over the entire test period. Results indicate that the 2008 financial crises drives much of the outperformance of the active strategy.

In summary, evidence from backtesting indicates that investors may be able to time the U.S. equity market based on the relative valuations of high-yield corporate bonds and small capitalization stocks.
Cautions regarding findings include:
- Backtests done on indexes (here, the Russell 2000 Index) do not take into account the costs of implementing the index as a tradable asset, which would tend to lower returns for both the strategy and the benchmark.
- As noted in the paper, the study does not account for trading frictions incurred in switching between the Russell 2000 Index and short-term Treasuries. Switching occurs “multiple times per year.”
- As noted in the paper, the test sample is not large (about 28) in terms of independent six-month signal development intervals and (especially) in terms of number of bull-bear cycles.
- Much of the outperformance of the strategy appears attributable to arguably very rare conditions during the 2008 financial crisis.
- As noted in the paper, data snooping bias is practically unavoidable when experienced investors apply their knowledge to historical data.
- To the extent that the distribution of test asset returns is wild, the statistics used in this study lose power to estimate future performance.
See “Credit Spread as a Stock Market Indicator” and “High-yield Funds Lead the Stock Market?” for different perspectives on the relationship between corporate credit conditions and future stock market performance.