Does expansion (contraction) of consumer credit indicate growing (shrinking) corporate sales, earnings and ultimately stock prices? The Federal Reserve collects and publishes U.S. consumer credit data on a monthly basis with a delay of about five weeks. Using monthly seasonally adjusted total U.S. consumer credit for January 1943 through February 2021 and monthly S&P 500 Index closes for January 1943 through March 2021, we find that:
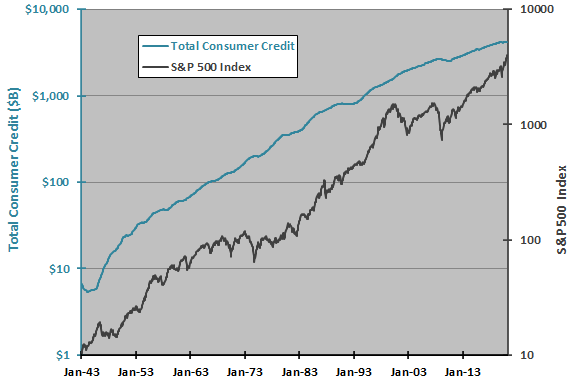
The following chart shows on logarithmic scales total U.S. consumer credit and the S&P 500 Index over the full sample period. Both series generally rise as the U.S. economy grows (and the dollar inflates), but the stock market is far more volatile than consumer credit. Visual inspection is not helpful in discovering a relationship between the two series.
To dig deeper, we relate changes in the two series.
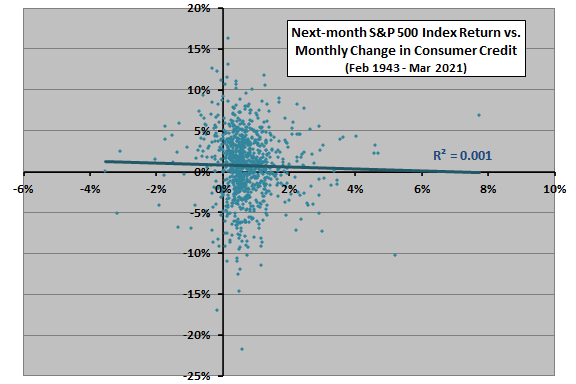
The following scatter plot relates next-month S&P 500 Index return to monthly change in consumer credit over the full sample period. The Pearson correlation between the two series is -0.02 and the R-squared statistic 0.001, indicating that monthly variations in consumer credit has very little to do with near-term stock market behavior.
Might change in consumer credit lead stock market return by some longer interval?
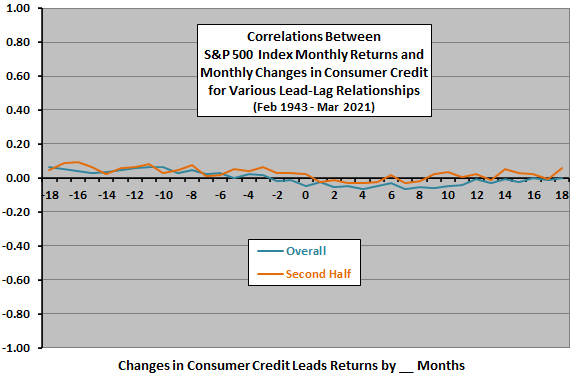
The next chart summarizes correlations for various lead-lag relationships between monthly S&P 500 Index return and monthly change in consumer credit, ranging from index return leads change in consumer credit by 18 months (-18) to change in consumer credit leads index return by 18 months (18), both for the overall sample period and for the second half of the sample period (starting at the end of February 1982).
All correlations are small, and variations appear to be mostly noise. There are perhaps consistent indications that:
- Relatively strong (weak) stock market returns over many months lead to relatively strong (weak) consumer borrowing.
- Relatively strong (weak) consumer borrowing is slightly unfavorable for the stock market over the next year. However, second-half data do not corroborate.
In case there is an important non-linearity in the monthly relationship, we look at average next-month S&P 500 Index returns by range of monthly changes in consumer credit.
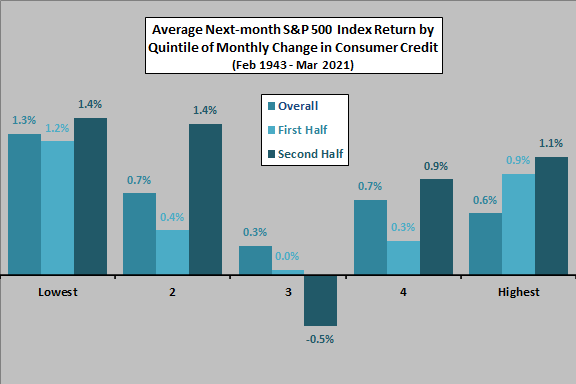
The next chart summarizes average next-month S&P 500 Index returns across ranked fifths (quintiles) of monthly changes in consumer credit over the full sample period (187-188 observations per quintile) and two equal subperiods (93-94 observations per quintile). The break point between subsamples is at the end of April 1981. Average S&P 500 Index return for all months in the full sample is 0.71%.
There is some indication that contractions in consumer credit are best for the stock market, but the relationship between change in consumer credit one month and stock market return next month is inconsistent across quintiles and across subsamples.
Standard deviations of future S&P 500 Index returns are higher for low than high quintiles.
Might a relationship between stock market return and consumer credit growth emerge only over a longer horizon? To check, we look at annual data.
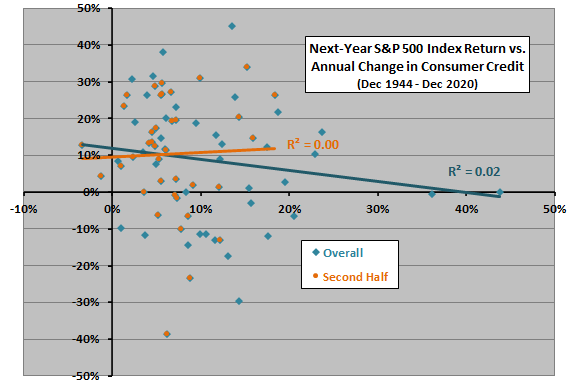
The next chart relates next-year S&P 500 Index return to annual change in consumer credit over the full period and the second half of the sample period (break point at the end of 1981).
The outliers on the right side of the chart for the full sample are two years immediately after World War II. More recent data suggests that consumer credit changes are neutral for the stock market, but the subsample is small.
Does stock market performance drive consumer risk-taking?
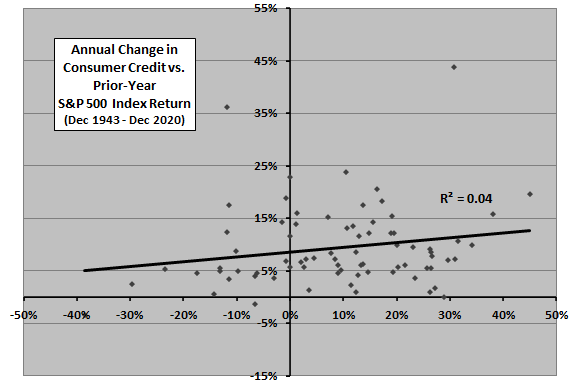
The final chart relates annual change in consumer credit to last-year S&P 500 Index return over the full sample period. Results suggest that a strong stock market has a modestly positive effect on consumer borrowing.
In summary, evidence from simple tests offers little support a belief that consumer credit is a useful indicator of future stock market behavior.
Cautions regarding findings include:
- Analyses do not precisely match the lag in Federal Reserve publication of consumer credit.
- As noted, the subsample of annual data are small for reliable inference.
- Revisions to the source dataset may inject look-ahead bias. Most revisions are small, but some may be material.
- Analyses are in-sample. An investor operating in real time during the sample period may find different results at different times.
- Findings do not rule out the possibility that surprises in consumer credit expansion/contraction, relative to some measurable expectation, more usefully forecast stock market returns.
Compare findings here for consumer credit with those in “Commercial and Industrial Credit as a Stock Market Driver”.