In reaction to “Combine Market Trend and Economic Trend Signals?”, a subscriber suggested adding an interest rate trend signal to those for the U.S. stock market and U.S. unemployment rate for the purpose of timing the S&P 500 Index (SP500). To investigate, we look at combining:
- The 10-month simple moving average (SMA10) for the SP500. The trend is positive (negative) when the index is above (below) its SMA10.
- The 12-month simple moving average (SMA12) for the seasonally adjusted U.S. civilian unemployment rate (UR). The trend is positive (negative) when UR is below (above) its SMA12.
- SMA12 for the average monthly 3-month U.S. Treasury bill yield (T-bill). The trend is positive (negative) when T-bill is below (above) its SMA12.
We consider scenarios when the SP500 trend is positive, the UR trend is positive, the T-bill trend is positive, at least one trend is positive (>=1), at least two trends are positive (>=2) or all three trends are positive (All). For total return calculations, we adjust the SP500 monthly with estimated dividends from the Shiller dataset. When not in the index, we assume return on cash from the broker is the specified T-bill yield. We focus on gross compound annual growth rate (CAGR), maximum drawdown (MaxDD) and annual Sharpe ratio as key performance metrics. We use the average monthly T-bill yield during a year as the risk-free rate for that year in Sharpe ratio calculations. While we do not apply any stocks-cash switching frictions, we do calculate the number of switches for each scenario. Using the specified monthly data through October 2017, we find that:
First, we look at average SP500 monthly returns and return variabilities by combined trend signal value, ranging from none of the three trends are favorable (0) to all three trends are favorable (3). Results indicate that having at least two trends favorable is likely desirable, and having less than two trends favorable is likely undesirable.
How do these findings translate to SP500 timing?

In backtesting market timing strategies, we make the following simplifications:
- The Bureau of Labor Statistics (BLS) releases UR monthly within a few days after the end of the measured month. We assume UR for a given month is available for SMA12 calculation and signal execution at the market close for that month, rather than a few days later.
- We assume that we can estimate SP500 and T-bill trends just before each monthly close for action on associated signals at the same close.
- We ignore dividends when calculating SP500 SMA10, but include them when calculating returns.
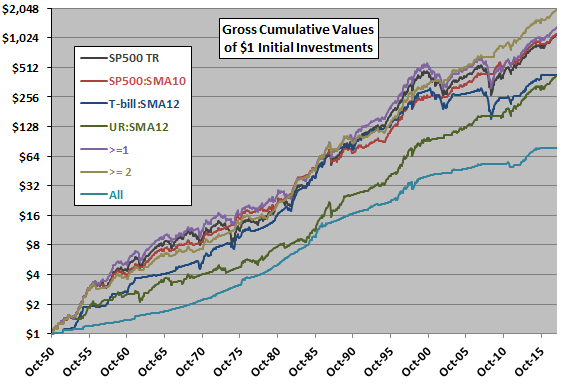
The following chart compares on a logarithmic scale gross cumulative values of $1 initial investments over the full sample period in each of seven scenarios:
- SP500 – buy and hold SP500.
- SP500:SMA10 – hold SP500 (T-bills) when SP500 at the end of the previous month is above (below) its SMA10.
- T-bill:SMA12 – hold SP500 (T-bills) when average T-bill yield for the previous month is below (above) its SMA12.
- UR:SMA12 – hold SP500 (T-bills) when UR at the end of the previous month is below (above) its SMA12.
- >=1– hold SP500 (T-bills) when at least one of scenarios 2-4 holds SP500 (otherwise).
- >=2– hold SP500 (T-bills) when at least two of scenarios 2-4 hold SP500 (otherwise).
- All – hold SP500 (T-bills) only when scenarios 2, 3 and 4 agree on holding SP500 (otherwise).
Notable findings are:
- >=2 has the highest terminal value, but it stands out only since the 2008-2009 financial crisis.
- SP500, SP500:SMA10 and >=1 perform similarly based on terminal values.
- T-bill:SMA12 and UR:SMA12 underperform the preceding based on terminal values, with the latter usually lagging the former.
- All is the worst performer based on terminal value, because it is not in stocks often enough (only 16% of the time, compared to 68% of the time for >=2 and 96% of the time for >=1).
A market timer would not easily have identified >=2 as a CAGR outperformer until well into the 2000s.
For deeper perspective, we compute key performance statistics.

The following table quantifies gross CAGRs, MaxDDs, annual Sharpe ratios and number of SP500-cash switches for the above seven scenarios. Notable points are:
- As indicated in the preceding chart, >=2 has the highest gross CAGR. It also has the highest gross annual Sharpe ratio and a competitively shallow MaxDD. However, it generates the most trades (about 1.7 per year). This strategy offers modest gross improvement of the Either strategy in “Combine Market Trend and Economic Trend Signals?”, at the cost of roughly twice the trades.
- The very simple SP500:SMA10 is reasonably competitive with >=2, with somewhat fewer trades.
- All has the shallowest MaxDD, but (as noted above) misses out on considerable stock market gain.
Lagging the UR signal by one month to ensure data availability has little effect on >=2.
For additional insight, we look at >=2 performance relative to SP500 by calendar year.

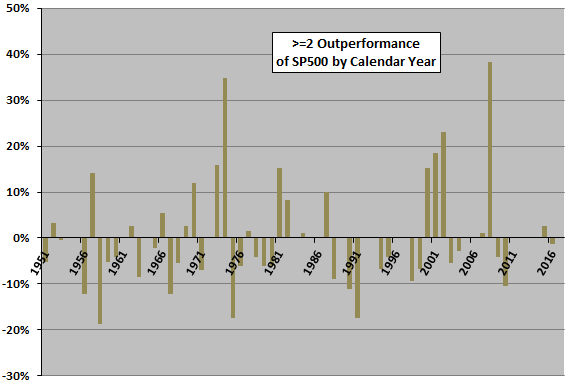
The final chart tracks annual gross returns of >=2 relative to SP500 over the available sample period. Notable points are:
- >=2 outperforms (underperforms) during 27 (28) years.
- 1974 and 2008 are exceptionally strong for >=2. Excluding these two years, >=2 has lower average gross annual return than SP500.
- Since 2008, >=2 underperforms SP500. It appears that the strategy beats SP500 only in U.S. stock market samples with severe bear markets.

In summary, evidence suggests that adding an interest trend signal offers little or no enhancement of dual stock market and unemployment rate trend signals for timing the U.S. stock market.
Cautions regarding findings include:
- As noted, performance data above are gross, to the advantage of scenarios that trade most frequently in comparison with buy-and-hold and scenarios that trade infrequently.
- Modeling of SP500 dividends is crude, and the assumption of instant and frictionless dividend reinvestment is unrealistic.
- As noted, cumulatives suggest that investors would probably not have discovered >=2 until after its successful 2000-2010 decade.
- There may be snooping bias in selecting UR trend for combination with equity market SMA10. In other words, UR may have worked best from a set of other economic statistics. Concentration of signal effectiveness in short segments of a sample (the 2001-2002 and 2008-2009 equity bear markets) makes snooping easy.
- In this and the cited analyses, we have also snooped a fair number of alternatives in terms of indicators and signals, such that best-performing combinations overstate expectations.
- As noted in “Combine Market Trend and Economic Trend Signals?”, a general concern with backtesting investment strategies using economic indicators is that the as-revised (downloadable) economic series sometimes impound look-ahead bias.