In response to “Exploiting Chicago Fed NFCI Predictive Power”, which tests practical use of the Federal Reserve Bank of Chicago’s National Financial Conditions Index (NFCI) for U.S. stock market timing, a subscriber suggested combining this strategy with stock market trend as in “Combine Market Trend and Economic Trend Signals?”. To investigate, we use the 40-week simple moving average (SMA40) for the S&P 500 Index to measure stock market trend. We then test two strategies that are each week in SPDR S&P 500 (SPY) or cash (U.S. Treasury bills, T-bills), as follows:
- Combined (< Mean): hold SPY (cash) when either: (a) prior-week S&P 500 Index is above (below) its SMA40; or, (b) prior-week change in NFCI is below (above) its mean since since the beginning of 1973.
- Combined (< Mean+SD): hold SPY (cash) when either: (a) prior-week S&P 500 Index is above (below) its SMA40; or, (b) prior-week change in NFCI is below (above) its mean plus one standard deviation of weekly changes in NFCI since the beginning of 1973.
The return week is Wednesday open to Wednesday open (Thursday open when the market is not open on Wednesday) per the NFCI release schedule. SMA40 calculations are Tuesday close to Tuesday close to ensure timely availability of signals before any Wednesday open trades. We assume SPY-cash switching frictions are a constant 0.1% over the sample period. Using weekly NFCI data since January 1973, weekly S&P 500 Index levels since April 1992, weekly dividend-adjusted opens of SPY and weekly T-bill yield since February 1993 (limited by SPY), all as specified through April 2020, we find that:
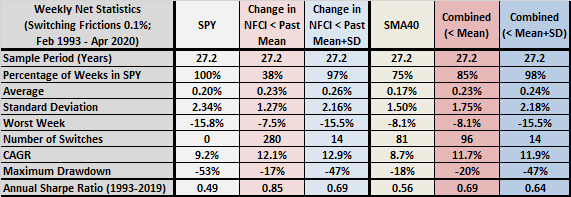
The following table compares net performance statistics for:
- SPY – buying and holding SPY.
- Change in NFCI < Mean – partial strategy 1(b) above.
- Change in NFCI < Mean+SD – partial strategy 2(b) above.
- SMA40 – partial strategy 1(a) and 2(a) above.
- Combined (< Mean) – combined strategy 1 above.
- Combined (< Mean+SD) – combined strategy 2 above.
Statistics include: sample length; percentage of weeks in SPY; average weekly return; standard deviation of weekly returns; worst week; number of SPY-cash switches; compound annual growth rate (CAGR); maximum drawdown; and, annual Sharpe ratio using average weekly T-bill yield during a year as the risk-free rate for that year and treating 1993 as a full year. Notable points are:
- SMA40 has a much shallower maximum drawdown and a modestly higher Sharpe ratio than SPY, at the cost of some CAGR.
- Combining SMA40 with NFCI-based signals does not improve performance for any performance metrics. The top-performing strategy based on CAGR is Change in NFCI < Mean+SD. The top-performing strategy based on maximum drawdown and Sharpe ratio is Change in NFCI < Mean.
Using a 44-week SMA to approximate a 10-month lookback more precisely makes little difference.
For perspective, we look at cumulative performance.

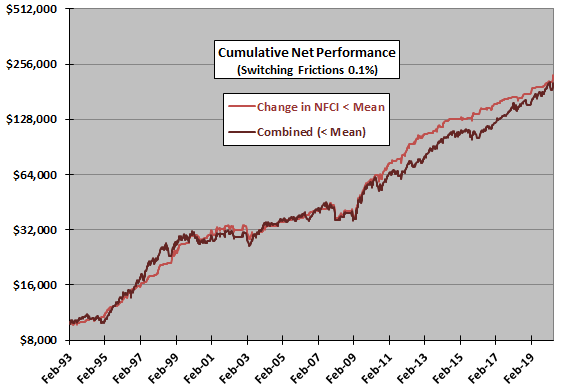
The following chart compares on a logarithmic scale cumulative net values of $10,000 initial investments in Change in NFCI < Mean and Combined (< Mean) over the full sample period. Notable points are:
- Differences in general trajectories are modest.
- Combined (< Mean) presents a bumpier ride than Change in NFCI < Mean, because it is in SPY much more often.

In summary, evidence does not support belief that adding a simple trend signal to signals from weekly changes in the NFCI improves U.S. stock market timing performance.
Cautions in “Exploiting Chicago Fed NFCI Predictive Power” mostly apply, and the selected SMA lookback interval may inherit data snooping bias from prior tests.