How do different asset classes interact with the Chinese yuan-U.S. dollar exchange rate? To investigate, we consider relationships between WisdomTree Chinese Yuan Strategy (CYB) and the exchange-traded fund (ETF) asset class proxies used in the Simple Asset Class ETF Momentum Strategy (SACEMS) and the Simple Asset Class ETF Value Strategy (SACEVS) at a monthly measurement frequency. Using monthly dividend-adjusted closing prices for CYB and the asset class proxies during May 2008 (when CYB is first available) through August 2020 (147 months), we find that:
The ETF asset class proxies are:
- PowerShares DB Commodity Index Tracking (DBC)
- iShares MSCI Emerging Markets Index (EEM)
- iShares JPMorgan Emerging Markets Bond Fund (EMB)
- iShares MSCI EAFE Index (EFA)
- SPDR Gold Shares (GLD)
- iShares Russell 2000 Index (IWM)
- SPDR S&P 500 (SPY)
- iShares Barclays 20+ Year Treasury Bond (TLT)
- Vanguard REIT ETF (VNQ)
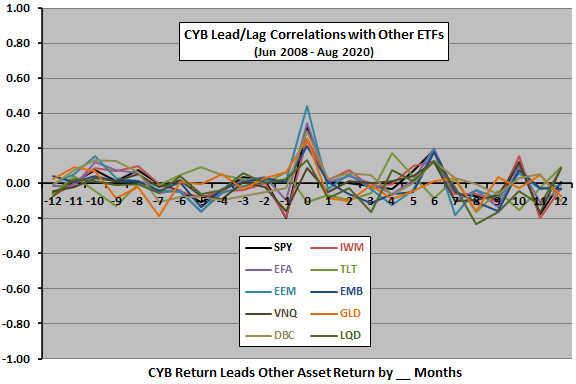
The following chart compares lead-lag correlations between CYB monthly returns and asset class ETF monthly returns, ranging from asset class ETF returns lead CYB return by 12 months (-12) to CYB return leads asset class ETF returns by 12 months (12). Results suggest that:
- Except for some contemporaneous relationships (0), correlations are modest and noisy. In other words, lead-lag relationships are unreliable.
- Contemporaneous correlations are mostly positive, most strongly for EEM and EMB. In other words, appreciation (depreciation) of the yuan relative to the U.S. dollar tends to be good (bad) for emerging market stocks.
- Contemporaneous correlation for TLT is distinct.
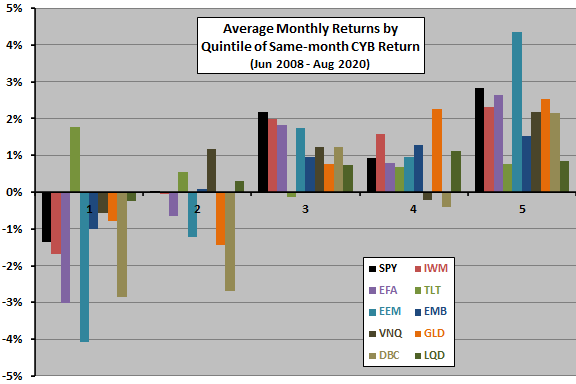
To check for non-linear effects, we look at average asset class returns by ranked fifth (quintile) of CYB returns.

The next chart summarizes average same-month returns of asset class ETFs by quintile of monthly CYB returns. There are only 29-30 observations per quintile. Results indicate that negative contemporaneous correlations are mostly in the bottom two quintiles of CYB returns. Average monthly return across asset classes for the bottom (top) quintile of CYB returns is -1.4% (+2.2%).
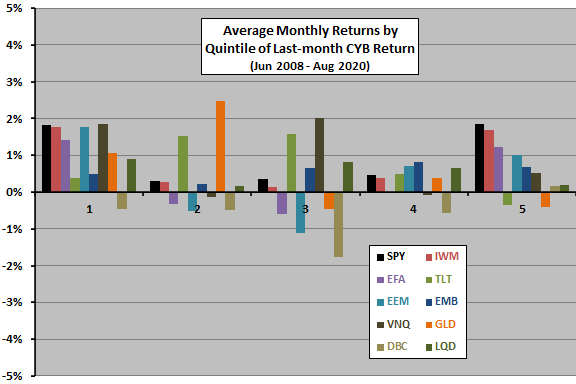
In case there is some non-linear predictive power of CYB return, we look at next-month asset class ETF returns.

The final chart summarizes average next-month returns of asset class ETFs by quintile of monthly CYB returns, using the same scale as the prior chart. As suggested by the top chart above, results are noisy and change in CYB has no notable power to predict next-month asset class ETF returns. Average monthly return across asset classes for the bottom (top) quintile of CYB returns is +1.1% (+0.7%).

In summary, evidence suggests that a strong (weak) yuan relative to the U.S. dollar is contemporaneously good (bad) for emerging market stocks and equities, but not for U.S. Treasury bonds. Yuan valuation changes are not predictive of returns for other classes.
Cautions regarding findings include:
- Sample size is small, especially in terms of quintile breakdowns and variety of market conditions. The influence of the Chinese yuan may grow materially over the sample period.
- All analyses are in-sample. An investor operating in real time could not have known the findings.
- Results may differ for other measurement frequencies.