Whenever the dollar persistently appreciates or depreciates versus some other currency, experts theorize. A depreciating dollar is good because U.S. exports boom and domestic employment rises. Or, a depreciating dollar is bad because capital flees the U.S., and import prices (especially for crude oil) spur inflation. Are there reliable and exploitable relationships between the euro/dollar and yen/dollar exchange rates and the U.S. stock market? To investigate, we apply regressions and rankings to characterize interactions between each exchange rate and the stock market. Using daily data for euro/dollar and yen/dollar exchange rates and the S&P 500 Index over the period January 2000 through most of June 2011 (about 12.5 years), we find that:
Trading days for the exchange rates and the U.S. stock market are not identical. We delete data for the days on which either the currencies or U.S. stocks do not trade, such that a few gaps between consecutive joint trading days involve an extra trading day for currencies or stocks.
The source data for the euro/dollar exchange rate is in dollars per euro. We invert these data, so that both series are in units of foreign currency per dollar.
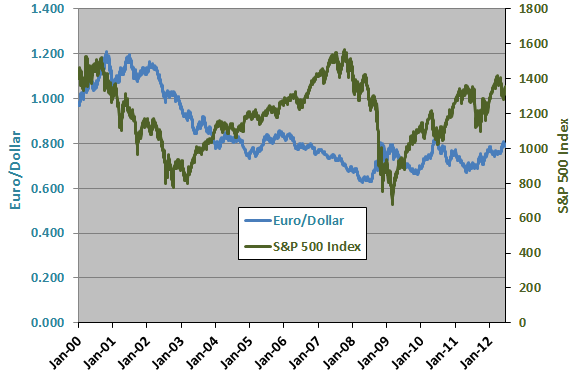
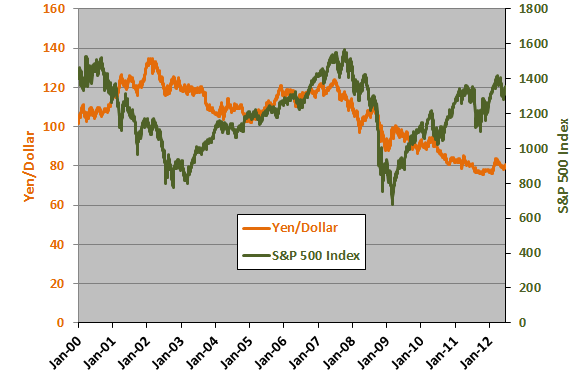
The following two charts compare the euro/dollar (number of euros that one dollar buys, upper chart) and yen/dollar (number of yen that one dollar buys, lower chart) exchange rates and the S&P 500 Index over the available sample period. During this time the dollar mostly weakens against both the euro and the yen (the number of each that one dollar buys goes down). The stock market exhibits fits of historically high volatility. Visual inspection suggests no persistent relationships between exchange rates and the stock market.
For a closer look, we relate changes in the two exchange rates to stock market returns.
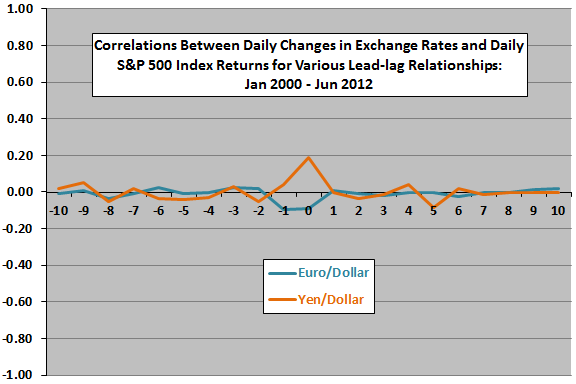
The next chart summarizes correlations of daily changes in the exchange rates with daily S&P 500 Index returns over the available sample period (3,118 trading days) for various lead-lag relationships, ranging from stock market returns lead changes in exchange rates by 10 trading days (-10) to changes in exchange rates lead stock market returns by 10 trading days (10). Results suggest that:
- There may be some same-day interaction, with depreciation of the euro (yen) slightly negative (positive) for U.S. stocks, or vice versa.
- The U.S. stock market may have a very weak tendency to lead changes in exchange rates in the same ways.
- Changes in exchange rates do not lead U.S. stock market returns.
Are the same-day correlations consistent over time?
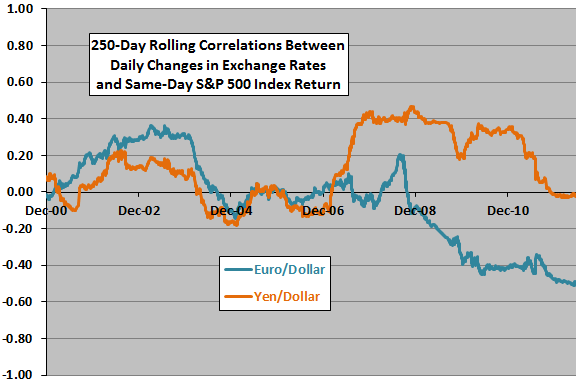
The next chart shows the 250-day (one year) rolling correlations between daily changes in the two exchange rates and same-day S&P 500 Index return over the available sample. Results show that the same-day correlations above are not consistent over one-year subperiods, varying considerably between positive and negative.
Might there be an exploitable non-linearity in the relationship?
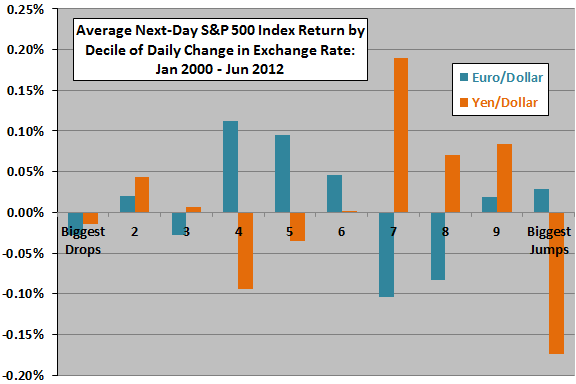
The next chart summarizes average S&P 500 Index same-day returns by decile (tenth) of ranked daily changes in both exchange rates over the available sample. There are 311-312 observations per decile. Note that drops (jumps) in the exchange rates relate to depreciation (appreciation) of the dollar versus the foreign currency. Results are highly irregular across deciles and inconsistent between euro and yen.
Might monthly data be more useful?
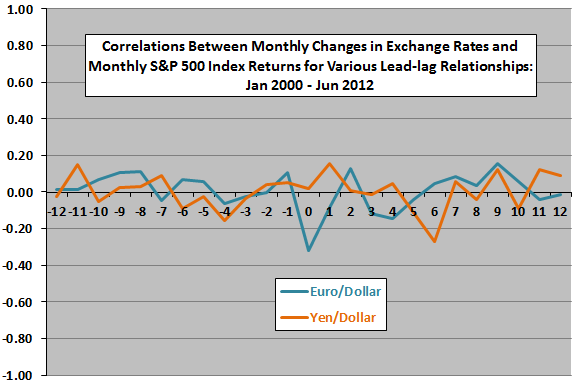
The next chart summarizes correlations of monthly (every 21st trading day) changes in the exchange rates with monthly S&P 500 Index returns over the available sample period (149 months) for various lead-lag relationships, ranging from stock market returns lead changes in exchange rates by 12 months (-12) to changes in exchange rates lead stock market returns by 12 months (12). Results appear to be mostly noise, with no useful predictive relationship in either direction.
What about quarterly data?
The final chart summarizes correlations of quarterly (every 63rd trading day) changes in the exchange rates with monthly S&P 500 Index returns over the available sample period (50 quarters) for various lead-lag relationships, ranging from stock market returns lead changes in exchange rates by six quarters (-6) to changes in exchange rates lead stock market returns by six quarters (6). Results again appear to be mostly noise, with no useful predictive relationship in either direction.
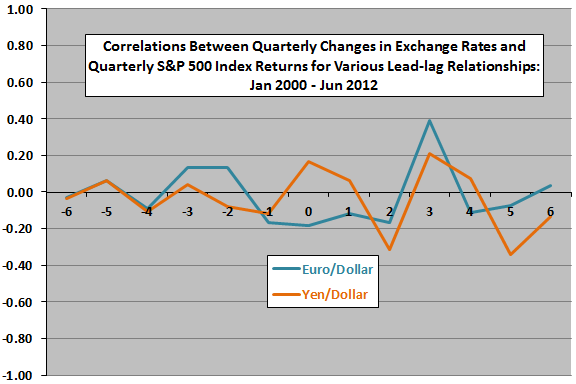
In summary, evidence from simple tests does not support a belief that changes in the euro/dollar and yen/dollar exchange rates are useful for predicting U.S. stock market returns at daily, monthly or quarterly horizons.
Cautions regarding findings include:
- Much of the above analysis is in-sample. As shown by the rolling correlations (fourth chart above), an investor operating in real time would draw different conclusions about the relationships between currency exchange rates and the U.S. stock market at different times.
- The number of quarters in the sample is not large for the kind of analysis summarized in the final chart.