How frequent, deep and long are currency carry trade (buying currencies with high interest rates and selling currencies with low interest rates) drawdowns, and how can traders mitigate them? In their January 2017 paper entitled “When Carry Goes Bad: The Magnitude, Causes, and Duration of Currency Carry Unwinds”, Michael Melvin and Duncan Shand analyze the worst currency carry trade peak-to-trough drawdowns in recent decades. They hypothesize that three variables affect drawdown duration: (1) financial market stress, as measured by a combination of seven financial variables; (2) carry opportunity, as measured by average interest rate of long currencies minus the average interest rate of short currencies; and, (3) a measure of spot exchange rate valuations based on purchasing power parities. Their carry trade strategy at the end of each month buys (sells) the three one-month forward currency contracts with the highest (lowest) interest rates and closes the contracts in the spot market at the end of the next month. They apply the strategy to developed markets, emerging markets and all currencies. For comparability, they scale each portfolio after the fact to 10% annualized return volatility over the sample period. They examine the ten deepest drawdowns for each portfolio. They investigate drawdown causes and mitigations using the 54 (49) deepest volatility-scaled drawdowns for developed (emerging) markets, corresponding to a cutoff of -1.5% drawdown. Using daily spot and one-month forward exchange rates with the U.S. dollar and monthly interest rates for nine developed market currencies since December 1983 and 20 emerging market currencies since February 1997, all through August 2013, they find that:
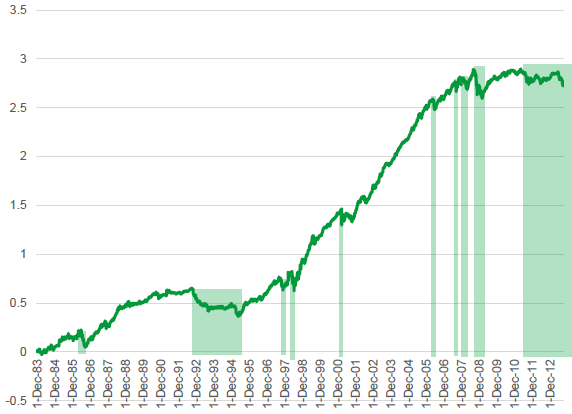
- The carry trade is usually a good performer, with few large drawdowns (see the chart below). The largest drawdowns differ considerably in depth and duration.
- During their common sample period:
- Developed markets carry trade underperforms emerging markets carry trade.
- The correlation between developed and emerging markets carry trade returns is just 0.26. When either the developed or emerging markets carry trade is in drawdown, the other is not in drawdown 41% of the time.
- Carry trade drawdown during the 2007-2009 financial crisis is much larger for developed markets than for emerging markets.
- Carry trade performance is poor for both developed and emerging markets since the financial crisis.
- The top ten carry trade drawdowns for:
- Developed markets range from -7.2% over 30 days to -32% over 399 days. The worst drawdown occurs during late-July 2007 to early February 2009.
- Emerging markets range from -5.3% over 48 days to -17% over 92 days. The worst drawdown occurs during mid-February 1998 to mid-June 1998.
- Combined markets range from -9.0% over 18 days to -23% over 130 days. The worst drawdown occurs during early August 2008 to early February 2009.
- Drawdown duration varies systematically with the three variables hypothesized to affect it. An out-of-sample timing strategy using a model combining the three variables to avoid parts of drawdowns improves carry trade gross monthly Sharpe ratios for developed markets, emerging markets and the combined sample from 0.18 to 0.20, 0.43 to 0.45 and 0.29 to 0.30, respectively.
The following chart, taken from the paper, tracks gross cumulative performance of the carry trade applied to all currencies as specified above (with emerging market currencies becoming available in February 1997). Shaded areas indicate the ten largest drawdowns. The strategy usually performs well, but there are crashes, as well as two multi-year drawdown episodes.

In summary, evidence indicates that the currency carry trade usually performs well but does encounter drawdowns that vary considerably in depth and duration, with a drawdown mitigation strategy offering modest relief.
Cautions regarding findings include:
- Performance results are gross, not net. Accounting for monthly portfolio reformation costs would reduce returns. These costs are likely higher during crises and for emerging than developed market currencies.
- Samples are not large in terms of number of drawdowns. The multi-year drawdowns in the early-to-middle 1990s and at the end of the sample period may be fundamentally different from the others. There seems no good reason to end the sample period 3.5 years ago.
- Tests that scale portfolio leverage after the fact may generate unrealistic scenarios.
- Differences in findings between developed and emerging market currencies regarding effects of potential risk mitigation variables undermine belief in conceptual arguments.
- The model used to relate potential risk mitigation variables to drawdown duration is complex and subject to model snooping bias. Reported improvements in Sharpe ratios seem too small to overcome this concern, plus the cost of executing the risk mitigation model.