Value Investing Strategy (Strategy Overview)
Momentum Investing Strategy (Strategy Overview)
Compendium of Live ETF Factor/Niche Premium Capture Tests
March 28, 2025 • Posted in
Some exchange-traded funds (ETF) focus on capturing potentially attractive factor premiums or thematic niches. Their histories offer a way to test these concepts live. We have conducted many such tests, listed here to offer a global view (a few may be unavailable at times for updates).
- “U.S. Equity Premium?” – evidence from simple tests on about 23 years of data suggests that stock market leadership shifts between the U.S. and other developed markets over time, but the U.S. may be better overall.
- “Tech Equity Premium?” – evidence from simple tests on 25 years of data suggests long boom, short bust for a tech/innovation-concentrated portfolio, with high market beta but little or no alpha.
- “Measuring the Size Effect with Capitalization-based ETFs” – evidence from simple tests of capitalization-based ETFs with nearly 22 years of data offers little support for belief in a long-term, reliably exploitable size effect among U.S. stocks.
- “Do Equal Weight ETFs Beat Cap Weight Counterparts?” – evidence from simple tests on some equal-weight U.S. equity ETFs offers little support for belief that equal weighting substantially and reliably beats capitalization weighting on a net basis.
- “Measuring the Value Premium with Value and Growth ETFs” – evidence from simple tests with 23.6 years of available data does not support belief that investors reliably capture a value premium via popular value-growth ETFs.
- “Are Equity Momentum ETFs Working?” – available evidence on attractiveness of momentum-oriented U.S. stock and sector ETFs is less than compelling.
- “Are Stock Quality ETFs Working?” – available evidence offers little support for belief that quality ETFs reliably beat respective benchmarks.
- “Are Low Volatility Stock ETFs Working?” – available evidence on attractiveness of low volatility stock ETFs is mixed, with recent data undermining belief in reliability of low volatility outperformance.
- “Are Equity Multifactor ETFs Working?” – available evidence offers little support for belief that equity multifactor ETFs reliably beat their benchmarks, or that they offer material diversification with comparable performance.
- “Are Hedge Fund ETFs Working?” – evidence on attractiveness of hedge fund-oriented ETFs is mostly adverse.
- “Are Managed Futures ETFs Working?” – available evidence on attractiveness of managed futures ETFs in aggregate (but with recent short-sample exceptions) suggests that benefits from diversification of equities and fixed income are unlikely to compensate for poor absolute returns.
- “Best Safe Haven ETF?” – evidence from simple tests over available and common sample periods suggests that silver, gold, longer-term U.S. Treasuries and investment grade corporate bonds are safe havens, while crude oil is clearly not.
- “Do High-dividend Stock ETFs Beat the Market?” – evidence from data for high-dividend U.S. stock ETFs does not support belief that high-dividend stocks reliably outperform the broad U.S. stock market.
- “Are ESG ETFs Attractive?” – available evidence suggests that ESG ETFs do not perform much differently from selected benchmarks.
- “How Are Renewable Energy ETFs Doing?” – available evidence on attractiveness of renewable energy ETFs is adverse overall, but with short bursts of market outperformance perhaps due to novelty.
- “How Are Robotics-AI ETFs Doing?” – available evidence is that robotics-AI ETFs are less attractive than the broader technology exposure offered by QQQ.
- “How Are AI-powered ETFs Doing?” – available evidence does not support belief that ETFs using AI to select and weight assets are particularly attractive.
- “Are Cybersecurity ETFs Attractive?” – available evidence suggests that cybersecurity ETFs underperform a broader investment in technology stocks.
- “Are iShares Core Allocation ETFs Attractive?” – available evidence regarding attractiveness of iShares Core Asset Allocation ETFs is mixed to negative.
- “Are Target Retirement Date Funds Attractive?” – evidence offers little support for belief that target retirement date mutual funds are preferable to simple stocks-bonds diversification.
- “How Are TIPS ETFs Doing?” – available evidence on attractiveness of TIPS ETFs is mostly favorable after the recent inflation burst, with shorter duration funds offering more reliable inflation protection.
- “Are Equity Index Covered Call ETFs Working?” – available evidence on attractiveness of equity index covered call ETFs as either substitutes for or diversifiers of underlying stock indexes is generally adverse.
- “Are Equity Put-Write ETFs Working?” – available evidence on attractiveness of equity put-write ETFs is adverse.
- “Are IPO ETFs Working?” – available evidence on attractiveness of IPO ETFs is mixed, requiring very high risk tolerance of interested investors.
- “Are Preferred Stock ETFs Working?” – available evidence on attractiveness of preferred stock ETFs relative to a 60-40 stocks-bonds portfolio is largely negative.
- “Do Convertible Bond ETFs Attractively Meld Stocks and Bonds?” – available evidence suggests that convertible bond ETFs sometimes outperform and sometimes underperform a conventional 60%-40% stocks-bonds portfolio.
- “Do ETFs Following Gurus/Insiders Work?” – available evidence on guru/insider-following stock ETFs offers little support for belief that investors can exploit guru wisdom.
- “Congressional Trade Tracking ETFs” – limited available evidence suggests that investors should choose a fund mimicking holdings of Democrat rather than Republican members of Congress.
- “The Long and Short of Jim” – available evidence does not support belief that funds based on Jim Cramer’s stock/market recommendations produce attractive short-term returns.
- “Live Test of the Stock Market Overnight Move Effect (Final)” -available evidence does not support belief in exploitability of the overnight move effect.
- “Using SVXY to Capture the Volatility Risk Premium” – evidence from simple tests on available data suggests that capturing the volatility risk premium with the new SVXY, may be somewhat attractive to risk-tolerant investors.
- “Testing IFED ETNs” – a short available sample confirms that IFED-based ETNs beat reasonable benchmarks, but outperformance may fade since inception.
- “How Are Laddered Buffer ETFs Doing?” – available evidence is that laddered buffer ETFs sacrifice some CAGR for shallower MaxDD as intended.
- “Live Test of the Short-term Reversal Effect” – evidence from UTRN performance does not support belief that typical investors can capture any short-term reversal effect.
- “How Are Uranium ETFs Doing?” – available evidence offers only modest, recent support belief that uranium ETFs may be attractive.
- “How Are Private Equity ETFs Doing?” – the limited available evidence for private equity ETFs is mostly adverse.
The upshot of the above items is that academic factor research and thematic speculations rarely translate to outperformance when implemented with ETFs.
A global caution is that the period since 2009 is strong for broad equity indexes, driven by a few large-capitalization firms, thereby disrupting factor and thematic concepts. This trend may not persist.
Of course, the Simple Asset Class Value Strategy (SACEVS) and the Simple Asset Class Momentum Strategy (SACEMS) also offer live tests, with considerable transparency.
Please log in or subscribe to continue reading...
Gain access to hundreds of premium articles, our momentum strategy, full RSS feeds, and more! Learn more
Team Management
June 27, 2023 • Posted in
[wlm_team_management]
Please log in or subscribe to continue reading...
Gain access to hundreds of premium articles, our momentum strategy, full RSS feeds, and more! Learn more
RSS Weekly
March 22, 2019 • Posted in
Please log in or subscribe to continue reading...
Gain access to hundreds of premium articles, our momentum strategy, full RSS feeds, and more! Learn more
Full RSS
February 5, 2019 • Posted in
Please log in or subscribe to continue reading...
Gain access to hundreds of premium articles, our momentum strategy, full RSS feeds, and more! Learn more
Edit Profile
January 30, 2019 • Posted in
You must be logged in to edit your profile.
Subscription Information
For questions about your subscription, including cancellations, please contact support.
Please log in or subscribe to continue reading...
Gain access to hundreds of premium articles, our momentum strategy, full RSS feeds, and more! Learn more
Combined Value-Momentum Strategy (SACEVS-SACEMS)
January 1, 2018 • Posted in
The Simple Asset Class ETF Value Strategy (SACEVS) seeks diversification across a small set of asset class exchange-traded funds (ETF) plus a monthly tactical edge from timing term, credit and equity risk premiums. The two versions of SACEVS are: (1) most undervalued premium (Best Value) ; and, (2) weighting all undervalued premiums according to respective degree of undervaluation (Weighted).
The Simple Asset Class ETF Momentum Strategy (SACEMS) seeks diversification across asset classes via ETFs plus a monthly tactical edge from intermediate-term momentum. The three versions of SACEMS, all based on total ETF returns over recent months, are: (1) top one of nine ETFs (Top 1); (2) equally weighted top two (EW Top 2); and, (3) equally weighted top three (EW Top 3).
Based on feedback from subscribers about combinations of interest, we look at three equal-weighted (50-50) diversifying combinations of SACEVS and SACEMS, rebalanced monthly:
- 50-50 Best Value – EW Top 2: SACEVS Best Value paired with SACEMS Equally Weighted (EW) Top 2 (aggressive value and somewhat aggressive momentum).
- 50-50 Best Value – EW Top 3: SACEVS Best Value paired with SACEMS EW Top 3 (aggressive value and diversified momentum).
- 50-50 Weighted – EW Top 3: SACEVS Weighted paired with SACEMS EW Top 3 (diversified value and diversified momentum).
Supporting research includes (items may at times be unavailable for a few days during updates):
- “SACEMS-SACEVS for Value-Momentum Diversification” tests benefits of diversifying across asset class ETFs based on both relative momentum and relative value.
- “SACEVS and SACEMS Strategy Momentum?” examines momentum of SACEVS and SACEMS returns to guide relative weighting of the two in a combined value-momentum strategy.
- “Suppress SACEVS Drawdowns in Combined SACEVS-SACEMS?” tests a shift to 100% SACEMS when the SACEVS Best Value holding is technically weak.
- “SACEVS Best Value + SACEMS EW Top 2?” tests an alternative to the tracked combined value-momentum strategy.
- “Substitute QQQ for SPY in SACEVS and SACEMS?” tests effects of using a different, thematic index for large capitalization stocks. “Horse Race: SSO or QQQ vice SPY in SACEVS and SACEMS?” extends that test to a comparison of thematic and leveraged stocks.
- “Forcing SACEMS to Agree with SACEVS” tests effects on Simple Asset Class ETF Momentum Strategy (SACEMS) performance of forcing SACEMS to agree with SACEVS when the latter assigns zero weight to stocks or government bonds.
- “SACEMS-SACEVS Diversification with Mutual Funds” provides an extended test of the benefits of diversifying across asset classes based on both relative momentum and relative value with sets of mutual funds.
- “SACEMS and SACEVS Changes for Coordination and Liquidity” documents minor April 2017 adjustments that trade purity of logic for practicality.
- “SACEVS-SACEMS Leverage Sensitivity Tests” explores use of margin rebalanced monthly to boost performance. “Conditionally Substitute SSO for SPY in SACEVS and SACEMS?” test a single specific leveraged asset substitution in SACEVS and SACEMS.
Some additional relevant but less directly applicable research is in the last list of items in “What Works Best?“.
Some investors may want to follow one of the 50-50 combined strategies. Others may want to modify the strategy with other than equal weights for SACEVS and SACEMS, as explored in “SACEMS-SACEVS for Value-Momentum Diversification”.
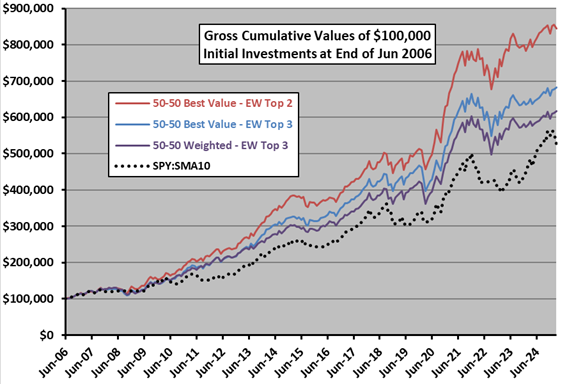
Cumulative Performance
The following chart tracks gross cumulative values of $100,000 initial investments in each of the above three combination strategies since the end of June 2006. It includes as a benchmark a simple technical strategy (SPY:SMA10) that holds SPDR S&P 500 ETF Trust (SPY) when the S&P 500 Index is above its 10-month simple moving average and 3-month U.S. Treasury bills (Cash, or T-bills) when below.
For perspective, we look at an array of performance metrics.
Performance Statistics
The following table summarizes annual/annualized returns for these three strategies, and for SPY and SPY:SMA10. Annualized returns are compound annual growth rates. Maximum drawdown is the deepest peak-to-trough drawdown for these strategies based on monthly measurements over the sample period. For Sharpe ratio, to calculate excess annual return, we use average monthly yield on 3-month Treasury bills during a year as the risk-free rate for that year.
Portfolio performance calculations are based on assumptions as summarized in Value Strategy and Momentum Strategy.
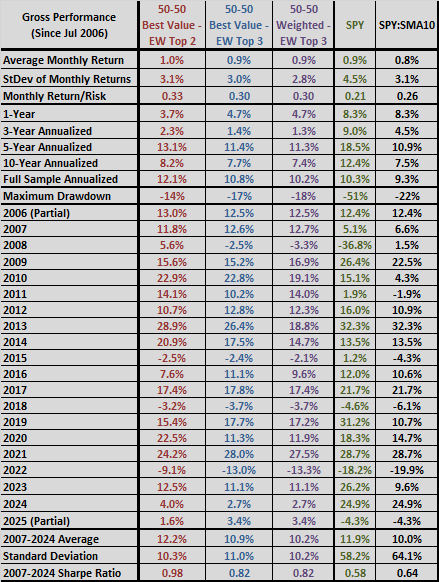
Something to keep in mind is that testing different SACEMS-SACEVS combinations and/or adjusting weights based on sensitivity tests incorporates data snooping bias, such that the best-performing combination overstates expectations.
Please log in or subscribe to continue reading...
Gain access to hundreds of premium articles, our momentum strategy, full RSS feeds, and more! Learn more
CXO Strategies
June 21, 2017 • Posted in
Please log in or subscribe to continue reading...
Gain access to hundreds of premium articles, our momentum strategy, full RSS feeds, and more! Learn more
Start Here
December 4, 2016 • Posted in
Please log in or subscribe to continue reading...
Gain access to hundreds of premium articles, our momentum strategy, full RSS feeds, and more! Learn more
Simple Asset Class ETF Value Strategy (SACEVS)
March 27, 2015 • Posted in
Government securities, corporate bonds and equities arguably compete for investments at increasing levels of inherent risk based on: (1) valuations relative to each other, measured by risk premiums; and, (2) attractiveness of these risk premiums relative to their respective historical norms.
The Simple Asset Class ETF Value Strategy (SACEVS) seeks diversification across a small set of U.S. Treasury note, corporate bond and stock ETFs [iShares 20+ Year Treasury Bond (TLT), iShares iBoxx $ Investment Grade Corporate Bond (LQD) and SPDR S&P 500 (SPY)], plus a monthly tactical edge from timing the following three risk premiums associated with these asset classes:
- Term – monthly difference between the 10-year Constant Maturity U.S. Treasury note (T-note) yield and the 3-month Constant Maturity U.S. Treasury bill (T-bill) yield.
- Credit – monthly difference between the Moody’s Seasoned Baa Corporate Bonds yield and the T-note yield.
- Equity – monthly difference between S&P 500 operating earnings yield and the T-note yield.
There are two versions of SACEVS: (1) Best Value, which at the end of each month picks the most undervalued premium (if any); and, (2) Weighted, which at the end of each month weights all undervalued premiums (if any) according to degree of undervaluation. Based on the assets considered, the principal benchmark is a monthly rebalanced portfolio of 60% SPY-40% TLT (60-40).
Supporting research includes (items may at times be unavailable for a few days during updates):
- “Make SACEVS More Adaptive?” examines use of a rolling, rather than an inception-to-date , lookback window for SACEVS calibration.
- “U.S. Federal Taxes and SACEVS, SACEMS” explores the effects of federal taxes (in taxable accounts) on SACEVS performance.
- “Forcing SACEMS to Agree with SACEVS” tests effects on Simple Asset Class ETF Momentum Strategy (SACEMS) performance of forcing SACEMS to agree with SACEVS when the latter assigns zero weight to stocks or government bonds.
- “SACEVS with Quarterly Allocation Updates” tests the effects on performance of quarterly rather than monthly portfolio reformation.
- “SACEVS with SMA Filter” examines whether applying a simple moving average (SMA) filter to SACEVS selections improves strategy performance.
- “SACEVS Applied to Mutual Funds” extends testing backward in time by using mutual funds rather than ETFs to capture undervalued premiums.
- “SACEVS and SACEMS from a European Perspective” investigates the effects of the U.S. dollar-euro exchange rate on strategy performances, addressing the perspective of a European investor.
- “Add REITs to SACEVS?” tests the addition of a real estate risk premium, derived from the yield on equity Real Estate Investment Trusts (REIT). “Add Utilities to SACEVS?” tests the addition of a utilities premium, derived from the yield on Utilities Select Sector SPDR Fund (XLU).
- “Substitute VIG for SPY in SACEVS and SACEMS?” tests a single specific asset substitution in SACEVS. “Conditionally Substitute SSO for SPY in SACEVS and SACEMS?” test a single specific leveraged asset substitution in SACEVS. “Substitute QQQ for SPY in SACEVS and SACEMS?” tests effects of using a different, thematic index for large capitalization stocks. “Horse Race: SSO or QQQ vice SPY in SACEVS and SACEMS?” extends that test to a comparison of thematic and leveraged stocks.
- “Effects of Execution Delay on SACEVS” looks at effects of delaying action on changes in SACEVS portfolio weights for up to 21 trading days.
- “SACEVS Performance When Interest Rates Rise” examines effects of interest rates changes on the strategy.
- “SACEVS Performance When Stocks Rise and Fall” investigates how the strategy performs when the U.S. stock market rises and falls.
- “SACEVS Input Risk Premiums and EFFR” tests how the strategy might react to increases in the Federal Funds Rate.
- “SACEVS with Margin” and “SACEVS-SACEMS Leverage Sensitivity Tests” explore use of margin rebalanced monthly to boost SACEVS performance.
- “SACEMS and SACEVS Changes for Coordination and Liquidity” documents minor April 2017 adjustments that trade purity of logic for practicality.
We started tracking SACEVS in 2015, with only slight adjustments since as documented in the above list.
Some investors may want to follow one of the two strategy alternatives tracked here. Others may want to adapt them with modifications suited to their individual goals and constraints. Still others may want to apply the analysis approaches to test other strategies. Something to keep in mind is that adding complexity to the strategy with refining variables/parameters increases the number of ways to optimize and thereby elevates potential for data snooping bias.
The next section summarizes historical (backtest) performance data.
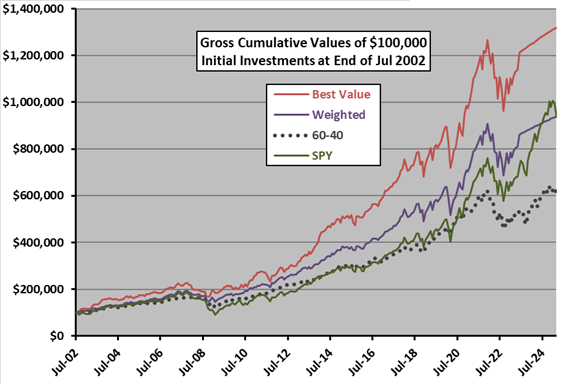
Historical Performance
The following chart shows the gross cumulative values of $100,000 initial investments in the Best Value and Weighted portfolios since the end of July 2002 (when all ETFs considered are first available). The chart includes the 60-40 portfolio as a benchmark and buying and holding SPY for reference.
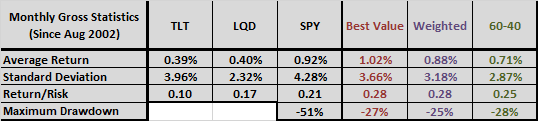
The following table summarizes some monthly statistics for these same strategies and their ETF components over the available sample period. Return/Risk is average return divided by standard deviation. Maximum (peak-to-trough) drawdowns are based on monthly measurements over the available sample period.
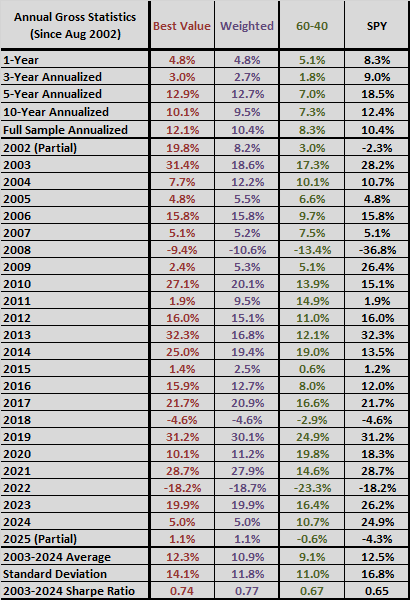
The next table summarizes annual/annualized returns for these strategies over different intervals commonly used to describe performance of funds. The annualized returns are compound annual growth rates (CAGR). For Sharpe ratio, to calculate excess annual return, we use average monthly yield on 3-month Treasury bills during a year as the risk-free rate for that year.
The next section offers a discussion of this performance.
Please log in or subscribe to continue reading...
Gain access to hundreds of premium articles, our momentum strategy, full RSS feeds, and more! Learn more
Real Earnings Yield (REY) Model
January 17, 2015 • Posted in
Do investors require a predictably substantial expected stock market real earnings yield (aggregate expected corporate operating earnings minus the expected inflation over the next 12 months, divided by stock index level)? In other words, when the forward real earnings yield is relatively high (low), do they bid stock prices up (down) to restore a normal gap between forward earnings yield and expected inflation. To investigate whether such a Real Earnings Yield (REY) model works, we relate the combined evolution of an operating earnings forecast for the S&P 500 and an inflation forecast to the behavior of the S&P 500 Index. To convert from the quarterly earnings cycle to a monthly frequency, we assume 50% / 40% / 10% of new earnings data for a quarter becomes known during the first / second / third month after quarter end. Availability of S&P 500 lagged (trailing 12 month) operating earnings from Standard and Poor’s as an earnings forecast input limits the sample period. Using monthly earnings forecast and S&P 500 Index data during March 1989 through December 2014, we find that: (more…)
Please log in or subscribe to continue reading...
Gain access to hundreds of premium articles, our momentum strategy, full RSS feeds, and more! Learn more