Are some stocks more sensitive to commodity prices than others? If so, is the variation exploitable? In their February 2011 paper entitled “The Stock Market Price of Commodity Risk”, Martijn Boons, Frans de Roon and Marta Szymanowska investigate the cross-sectional variation in stock returns associated with commodity price changes by calculating betas for individual stocks and industry portfolios relative to a broad open interest-weighted commodity futures index. They calculate commodity futures index returns based on a nearest-to-maturity rollover. They calculate stock betas against this return series (commodity betas) each month based on rolling 60-month historical regressions. They then form 25 value-weighted portfolios each month based on the intersections of independent lagged commodity beta and lagged size quintile rankings and use these portfolios to measure future return implications of commodity beta. Using monthly futures price and open interest data for 33 liquid commodities from 1975 (when futures prices for at least 20 commodities are available) through 2008, along with contemporaneous data for a broad sample of U.S. stocks and 48 industry portfolios, they find that:
- Over the sample period, the aggregate roll return on the specified commodity index is economically small and statistically insignificant. However, return correlations suggest that investing in different commodity sectors and adding commodities to a portfolio of stocks offer valuable diversification.
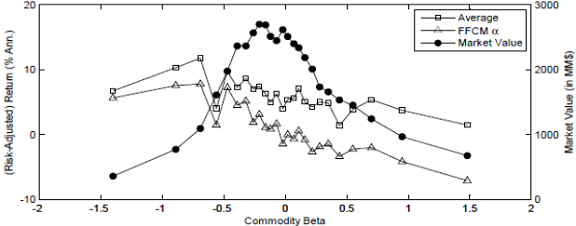
- There is substantial variation in commodity beta among individual stocks (see the chart below), with low commodity beta stocks outperforming high commodity beta stocks by an average 4.9% gross annually. This outperformance translates to annual market, three-factor (plus size and book-to-market) and four-factor (plus momentum) gross alphas of 6.6%, 4.5% and 8.7%, respectively, suggesting that commodity beta is a distinct risk factor that could improve existing factor models.
- Results generally extend to a set of 48 industries, with low commodity beta industries outperforming high commodity beta industries by about 2.3% gross annually (four-factor annual gross alpha 5.4%). However, variation of industry returns is not systematic across commodity beta quintiles.
- The power of commodity beta to predict stock returns is:
- Stronger, and more systematic across quintiles, for big stocks than small stocks. For the top (bottom) size quintile, the difference in average gross annual returns for stocks with low and high commodity betas is 4.8% (1.7%).
- Stronger during recessions. During recessions (expansions), the difference in average gross annual returns for stocks with low and high commodity betas is 1.9% (18.7%). The comparable average spread for industries is 0.3% (12.6%).
- With respect to commodity sectors:
- Sorting stocks on Energy beta or Livestock and Meats beta produces no meaningful gross return spread.
- Low Metals and Fibers beta outperforms high beta by an average 4.0% gross per year for both individual stocks and industries.
- Low Agriculture beta slightly outperforms high beta for both individual stocks and industries.
- Results are generally robust to different commodity index definitions and rebalancing annually rather than monthly.
- Commodity beta effects likely represent a cost of hedging inflation risk. Investors are willing to pay higher prices (accept lower expected returns) for high commodity beta stocks because these stocks offer protection from inflation surprises.
The following chart, taken from the paper, shows distributions of average annual gross returns, average annual gross four-factor alphas and sizes by commodity beta for a broad sample of U.S. stocks sorted monthly into 25 value-weighted portfolios over the period January 1975 to December 2008 as described above. Results indicate that: (1) the lower the commodity beta, the higher the return and four-factor alpha (though progressions are not smoothly systematic); and, (2) stocks with extreme commodity betas tend to be smaller.


In summary, evidence indicates that stocks and industries with muted responses to lagged changes in commodity futures prices (especially Metals and Fibers) tend to outperform those with pronounced responses.
The large difference between three-factor and four-factor alphas suggest some portfolio selection strategy combining return momentum and commodity beta.
Cautions regarding findings include:
- Reported returns are gross, not net. Including reasonable trading frictions would reduce returns and may alter conclusions, but robustness of findings to annual portfolio rebalancing mitigates this concern.
- It would be interesting to know whether some simpler measure of commodity prices produces a meaningful commodity risk premium across individual stocks and industries.