Should retirement portfolios include an allocation to managed futures? In his October 2017 paper entitled “Using Trend-Following Managed Futures to Increase Expected Withdrawal Rates”, Andrew Miller compares seven 30-year retirement scenarios via backtests and modified backtests. Specifically, he compares maximum annual real withdrawal rates as a percentage of initial assets that do not exhaust any 30-year retirement portfolios starting each year during 1926-2012 (SAFEMAX). The seven scenarios, all rebalanced annually, are:
- Historical Returns 50-50: uses actual annual returns for a 50% allocation to large-capitalization U.S. stocks and a 50% allocation to intermediate-term U.S. Treasuries.
- Historical Returns 50-40-10: same as Scenario 1, except shifts 10% of the Treasuries allocation to a trend-following managed futures strategy that is long and short 67 stocks, bonds, currencies and commodities futures series based on equally weighted 1-month, 3-month and 12-month past returns with a 10% annual volatility target.
- Lower Historical Returns 50-50: same as Scenario 1, but reduces monthly returns for stocks and Treasuries by 0.19%, reflecting end-of-2016 valuations.
- Lower Historical Returns 50-40-10: same as Scenario 2, but reduces monthly returns for stocks, Treasuries and managed futures by 0.19%.
- Lower Managed Futures Sharpe Ratio 50-40-10: same as Scenario 2, but reduces the Sharpe ratio for managed futures from an historical level to 0.5.
- Lower Historical Returns/Lower Managed Futures Sharpe Ratio 50-40-10: same as Scenario 4, but reduces Sharpe ratio for managed futures to 0.5.
- Historical Returns 50-50 with Trend Following for Stocks: same as Scenario 1, but each month puts the stocks allocation into stocks (30-day U.S. Treasury bills) when the return on stocks is positive (negative) over the prior 12 months.
He ignores all trading frictions, fees and taxes. Using monthly asset class returns as specified and monthly inflation data during January 1926 through December 2012, he finds that:
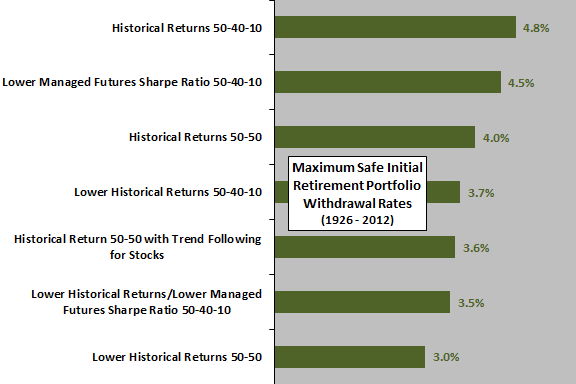
- Only three of seven scenarios achieve at least the conventional 4.0% SAFEMAX (see the chart below). All three assume assets perform as they did during 1926-2012.
- Of the four scenarios falling short of a 4.0% SAFEMAX:
- Three involve lowering past returns to levels arguably reflective of recent high asset class valuations.
- One involves historical returns with trend following for stocks. Applying trend following for stocks lowers SAFEMAX.
The following chart, constructed from data in the paper, summarizes SAFEMAX levels for all seven 30-year retirement portfolio scenarios, ordered from highest to lowest. Results suggest that:
- Diversifying stocks and Treasuries with managed futures helps.
- If recent asset class valuation levels indicate lower future returns, achieving a conventional retirement portfolio initial withdrawal rate is problematic.

In summary, evidence suggests that a modest allocation to trend following managed futures may boost the maximum safe withdrawal rate for U.S. retirement portfolios.
Cautions regarding findings include:
- The sample period is very short in terms of independent 30-year retirement intervals (only 2.9).
- As noted in the paper, results are gross of trading frictions, fees and taxes, including:
- Costs/fees for creating liquid funds from input return series, which are essentially indexes.
- Trading frictions involved in annual rebalancing of retirement portfolios.
- Testing many models (scenarios) on same input data introduces snooping bias, such that the best-performing models overstate expectations (are lucky in sample).
- Calculations assume actual management futures volatility equals target volatility (perfect volatility predictions).
See “Are Managed Futures ETFs Working?” for an indication whether managed futures implemented via exchange-traded funds (ETF) perform as expected.
See also: