What is the interplay among investable proxies for the U.S. dollar, gold and crude oil? Do changes in the value of the dollar lead those in hard assets? To investigate, we relate the return series of three exchange-traded funds: (1) the futures-based PowerShares DB US Dollar Index Bullish (UUP); (2) the spot-based SPDR Gold Shares (GLD); and, (3) the spot-based United States Oil (USO). Using monthly, weekly and daily prices for these funds during March 2007 (limited by inception of UUP) through April 2018 (134 months), we find that:
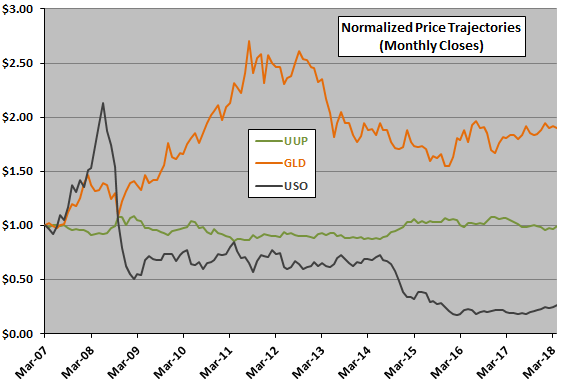
The following chart shows the price trajectories of UUP, GLD and USO (all initially normalized to $1.00) over the available sample period based on monthly data. Interplay among funds based on inspection of this chart is not obvious. Average monthly returns over the sample period for UUP, GLD and USO are 0.02%, 0.62% and -0.57%, respectively, with standard deviations 2.47%, 5.36% and 9.27%.
For precision, we relate monthly changes between UUP and GLD, and between UUP and USO.
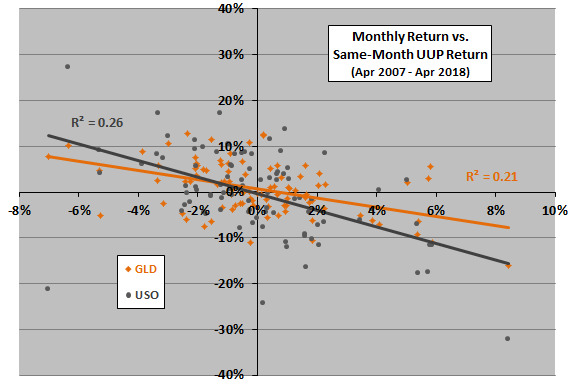
The following scatter plot relates monthly returns for GLD and USO to same-month returns for UUP over the available sample period. Both GLD and USO tend to move oppositely to UUP. Specifically:
The Pearson correlation between UUP and GLD monthly returns is -0.43 with R-squared statistic 0.21, indicating that UUP returns explain 21% of GLD returns (or vice versa).
The Pearson correlation between UUP and USO monthly returns is -0.48 with R-squared statistic 0.26, indicating that UUP returns explain 26% of USO returns (or vice versa).
In case there is an interesting non-linearity, we examine average GLD and USO returns by ranges of UUP returns.
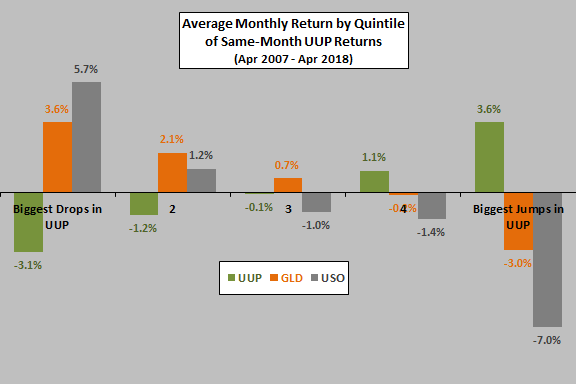
The next chart summarizes average monthly returns for UUP, GLD and USO by quintile (ranked fifth) of UUP monthly returns over the available sample period. GLD and USO exhibit systematic responses to changes in UUP. USO responds very negatively (positively) to large jumps (drops) in UUP.
The number of observations per quintile is only 26-27, small for reliable inference.
Does UUP reliably lead or lag GLD and USO?
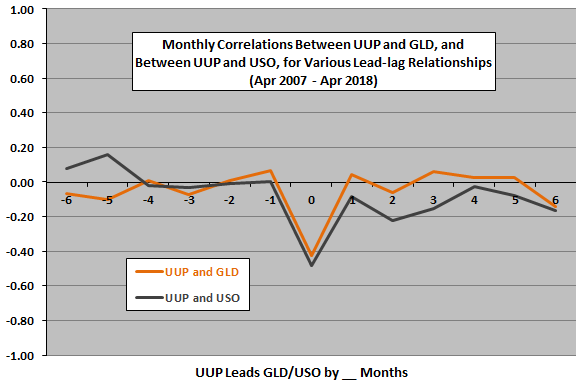
The next chart summarizes correlations between monthly returns for UUP and GLD and between monthly returns for UUP and USO for various lead-lag relationships, ranging from UUP lags hard assets by six months (-6) to UUP leads hard assets by six months (6).
Results indicate that the UUP-GLD and UUP-USO relationships are largely coincident measured at a monthly frequency. There is some indication of a delayed reaction to UUP moves by USO over the next three months.
Do any clear lead-lag relationships show up for higher frequency data?
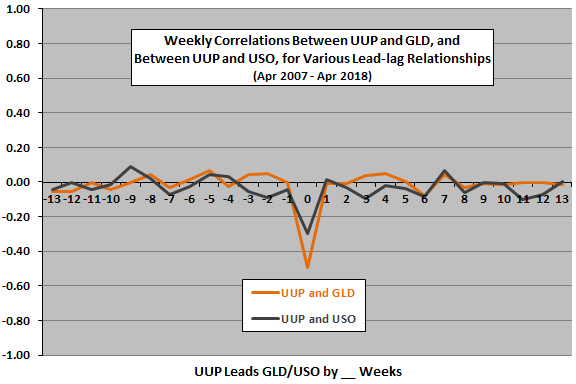
The next chart summarizes correlations between weekly returns for UUP and GLD and between weekly returns for UUP and USO for various lead-lag relationships, ranging from UUP lags hard assets by 13 weeks (-13) to UUP leads hard assets by 13 weeks (13).
Results indicate that the UUP-GLD and UUP-USO relationships are essentially coincident measured at a weekly frequency.
What about daily data?
The final chart summarizes correlations between daily returns for UUP and GLD and between daily returns for UUP and USO for various lead-lag relationships, ranging from UUP lags hard assets by 10 days (-10) to UUP leads hard assets by 10 days (10).
Results indicate that the UUP-GLD and UUP-USO relationships are coincident measured at a daily frequency.

In summary, evidence from simple tests indicates that hard assets proxied by GLD and USO tend to move oppositely to U.S. dollar futures proxied by UUP, with some indication that the response of USO stretches out over a few months.
Cautions regarding findings include:
- As noted, UUP is futures-based, while GLD and USO are spot-based. UUP therefore includes expectations of currency traders.
- As noted, quintile subsamples used above for monthly data are small for inference.