How many commodity sectors are relevant for portfolio diversification planning, and how do their behaviors differ? In their December 2011 paper entitled “How Many Commodity Sectors Are There, and How Do They Behave?”, Geetesh Bhardwaj and Adam Dunsby examine the statistical properties of commodity futures prices to discover natural sectors and investigate how returns for these sectors behave under different market conditions. They estimate commodity futures returns based on continually rolling at the end of each month to a long position in the nearest contract that does not have first notice day or expiration date during the next month. They measure all returns as “excess” relative to the one-month Treasury bill yield. They define economic expansions and recessions based on National Bureau of Economic Research (NBER) business cycle dates. They define extreme conditions for economic conditions and the stock market as 5% tails. Using monthly futures-only returns for May 1990 through September 2011 and spot returns as available to extend price histories back through the 1970s for 25 individual commodities, monthly returns for stocks (S&P 500 Index), U.S. bond indexes and the U.S. dollar index and several contemporaneous economic measurements, they find that:
- There are five natural commodity sectors: industrial metals, energy, precious metals, grains/oilseeds and livestock. The often-grouped soft (cotton, coffee, cocoa and sugar) commodities are not a statistically coherent sector.
- A broadly diversified portfolio of commodities adequately diversifies equities. Correlations between the five commodity sectors (and the soft group) and U.S. stocks range from -0.21 to 0.19, and the correlation between an equally weighted commodity portfolio and U.S. stocks is 0.01.
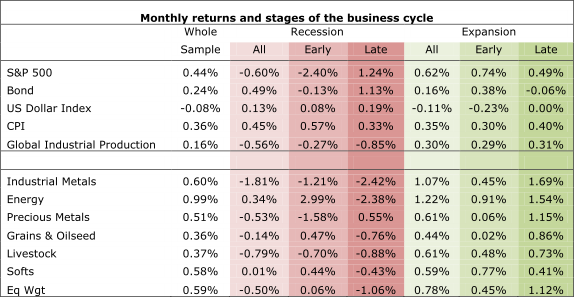
- In general, commodity returns are weak during U.S. recessions and strong during U.S. expansions (see the chart below). The industrial metals commodity sector is especially sensitive to the state of the economy, earning poor (strong) returns during recessions (expansions), while the grains/oilseeds sector is insensitive. Precious metals do not hedge poor economic conditions.
- The correlation between an equally weighted commodity index and U.S. inflation (unexpected inflation, the difference between monthly change in the consumer price index and monthly one-month Treasury bill yield) is 0.28 (0.53), compared to -0.18 (-0.21) for U.S. stocks. The energy and precious metals commodity sectors are the best hedges against high inflation and unexpectedly high inflation.
- The correlation between an equally weighted commodity index and the U.S. dollar index is -0.41, indicating that a diversified portfolio of commodity futures hedges dollar weakness.
- With respect to protection against crashes (the worst 5% of months in the sample):
- During extreme U.S. recessions, commodity futures generate mostly negative returns. The industrial metals commodity sector is weakest, with average monthly gross excess return about -1.8%.
- During U.S. stock market crashes, all commodity sectors except grains/oilseeds have negative returns. The industrial metals sector is again weakest, with average monthly gross excess return about -4.2%.
- During U.S. dollar crashes, all commodity sectors earn positive returns, paced by industrial metals and precious metals, with average monthly gross excess returns about 4.3% and 4.0%, respectively.
- During spikes in U.S. inflation, the energy commodity sector generates a large average monthly gross excess return of 6.7%, but livestock sector returns are significantly negative.
- During spikes in unexpected U.S. inflation, all commodity sectors except livestock earn positive returns, led by energy and precious metals with average monthly gross excess returns about 6.0% and 5.0%, respectively.
The following table, taken from the paper, summarizes average monthly gross excess returns of U.S. stocks, bonds, commodity sectors and the U.S. dollar index during recession and expansion stages of the business cycle, and more finely by the early and late parts of these stages over the sample period through June 2009 (after which NBER has not yet designated a stage). “Eq Wgt” is an equally weighted portfolio of commodity sectors, rebalanced monthly. The chart also shows are average monthly changes in the U.S. consumer price index (CPI) and global industrial production. Results show that, while commodity returns are generally weak during recessions and strong during expansions, variation across commodity sectors is substantial.

In summary, evidence from the past four decades indicates that there are five well-defined sectors for commodity futures, with varying responses to different economic conditions and crises.
Cautions regarding findings include:
- Despite strong correlations, spot commodity returns may differ materially from commodity futures returns due to anticipation of storage costs, demand for hedging and speculation.
- As noted, reported commodity returns are gross, not net. Including frictions for rolling from contract to contract would reduce these returns.
- The authors measure hedging and crash protection properties retrospectively and in-sample. NBER identifies recession and expansions long after initiation. An investor operating in real time may well identify recessions/expansions and extreme conditions differently based on then-available data.