In their February 2011 book chapter entitled “Seasonal Anomalies”, Constantine Dzhabarov and William Ziemba describe, update and assess several published U.S. stock market anomalies, most of which are directly or indirectly calendar-driven. They update using returns for stock index futures as a low-friction approach to exploiting calendar anomalies. They acknowledge the possible materiality of data mining/snooping bias in past findings and the difficulty of proving statistical significance even in large samples due to high return variability. Using returns for S&P 500 Index and Russell 2000 Index futures from February 1993 through December 2010 to update analyses of these anomalies, they find that:
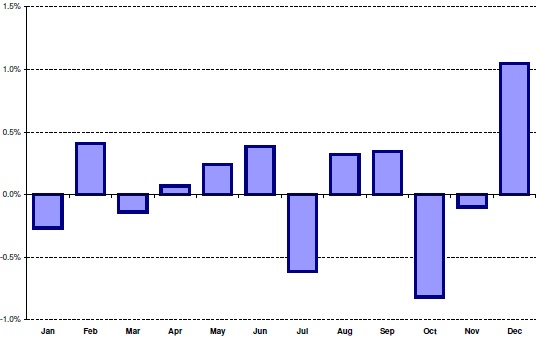
- The January effect, a tendency of small stocks to outperform large stocks in January, still exists but has moved to December. Specifically, the average monthly return spreads between Russell 2000 Index futures and S&P 500 Index futures during 1993-2010 and 2004-2010 is positive in December and negative in January (see the first chart below). Evidence suggests that small stocks outperform large stocks at the turn of the year, but trading frictions offset most or all profits in cash markets.
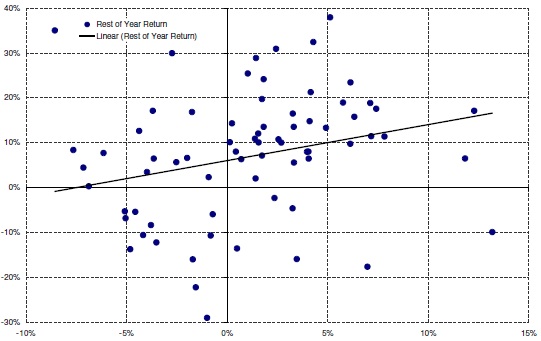
- The January barometer, a tendency for the stock market to show a gain for the rest of the year when January is up, adds value. For the 71 years spanning 1940-2010, when the S&P 500 Index is up (down) during January, it is up (down) for the rest of the year 86.4% (48.1%) of the time (see the second chart below). For 1994-2010, when January is up, the rest of the year is up 80% of the time.
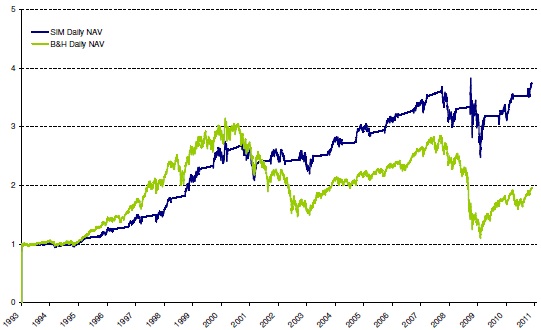
- The sell-in-May-and-go-away (Halloween) effect, in stocks during November-April and out during May-October, adds value. An investment of $1 in S&P 500 (Russell 2000) Index futures on February 4, 1993 grows to $1.96 ($2.04) by December 31, 2010 for a continuously long position, but $3.73 ($4.94) for a rule that buys on the sixth trading day before the end of October and sells the first trading day of May (see the third chart below).
- The same-month-next-year effect, wherein returns tend to echo those from 12 months prior, may exist (no assessment or update offered).
- The holiday effect, wherein returns tend to be high before holidays, has shifted and weakened. Data for S&P 500 Index and Russell 2000 Index futures spanning 1993-2010 suggests that the effect now concentrates in the third trading day before holidays and is much weaker than in the past. There may be special effects associated with extended Jewish and Islamic holidays.
- Seasonality calendars, which rank days from best to worst in terms of average stock market returns, suggest that the following anomalies offer positive returns (for S&P 500 Index and Russell 2000 Index futures): third trading day before holidays; turn-of-the-month; turn-of-the-year; and, third trading day before options expiration.
- Political effects, which tie stock market returns to the cycle of political events, include: stocks tend to underperform when Congress is in session; stock market returns tend to follow the U.S. election cycle; and, small (large) stocks tend to outperform under Democrat (Republican) presidencies.
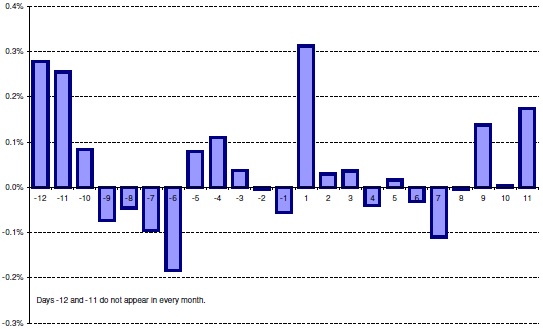
- Turn-of-the-month effect, wherein stock market returns tend to be abnormally high around the ends/beginnings of calendar months, still exists with a bit of anticipation as evidenced by the average daily behaviors of S&P 500 Index and Russell 2000 Index futures during 1993-2010 and 2004-2010 (see the fourth chart below).
- Daily reversal of overnight returns, a negative correlation between overnight return and the return during the ensuing trading day, may exist (no assessment or update offered).
- Industry concentration, weather and lunar cycles may affect stock market returns: firms in the least concentrated industries tend to outperform those in the most concentrated; sunshine tends to be better for stocks than cloudy weather; and, stock returns tend to be higher around new moons than full moons. (The authors offer no assessments or updates.)
The following chart, taken from the book chapter, shows average monthly return spreads by calendar month between Russell 2000 Index futures and S&P 500 Index futures during 1993-2010. The published January size effect is not in evidence, perhaps due to an anticipatory shift back into December.

The next chart, also from the book chapter, relates the return on the S&P 500 Index for February-December to the return for the preceding January during 1940-2010. While the scatter is fairly dispersed, it indicates some tendency for January returns to predict rest-of-the-year returns.

The next chart, also from the book chapter, compares cumulative net asset values (NAV) during 1993-2010 for: (1) a strategy (SIM) that holds S&P 500 Index futures from the sixth trading day before the end of October and to the beginning of May and otherwise holds Treasury bills; and, (2) a strategy (B&H) that holds S&P 500 Index futures continuously. Results for Russell 2000 Index futures are similar. In both cases, Sell-in-May-and-go-away beats buy-and-hold.

The last chart, also from the book chapter, shows average daily S&P 500 Index futures returns from 12 trading days before the end of the month (-12) to 11 trading days after the end of the month during 1993-2010. Results suggest some positive turn-of-the-month effect, with days -5 to +2 all positive except -1 and -2 (which have small losses).

In summary, evidence from a broad stream of research on calendar effects suggests that some, such as the January barometer, the sell-in-May-and-go away effect and the turn-of-the-month effect, may have some value for investors.
Reservations regarding these findings include:
- As noted by the authors, considerable data snooping bias may be impounded in the effects covered, both directly from intense data mining and indirectly from reuse of past data-mined results.
- Results may be sensitive to assumptions about trading frictions (often ignored in studies) and delays in acting on trading triggers. The updates based on stock index futures presumably present gross, not net returns.
- In much prior research, significance tests assume normal return distributions. The wildness observed in actual data undermines the meaningfulness of such tests.
The “Calendar Effects” and “Political Indicators” categories include research summaries and analyses for most of the anomalies listed above (plus more).