Does the broad U.S. stock market, as represented by SPDR S&P 500 (SPY), exhibit reliable day-of-the-week and/or overnight return anomalies? To check, we consider three returns:
- Close-Open: measured from prior close to open. (For example, the Monday Close-Open return is from the close on the prior trading day, usually Friday, to the open on Monday.)
- Open-Close: measured from open to close.
- Close-Close: measured from prior close to close.
We calculate these returns overall, by day of the week and by the number of calendar days since the prior close (for example, three days for a normal weekend). Using daily opening and closing prices for SPY during end of January 1993 through most of August 2017 (6,188 days), we find that:
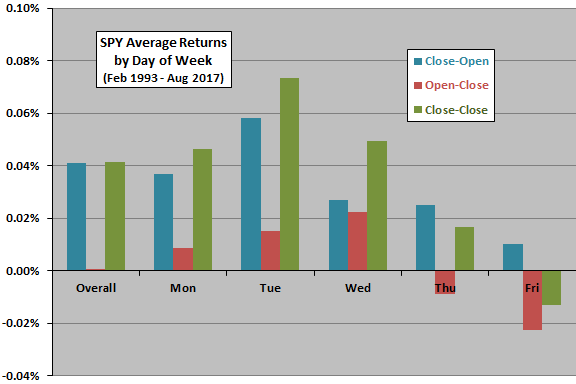
The following chart summarizes SPY average Close-Open, Open-Close and Close-Close returns overall and by day of the week over the available sample period. The numbers of observations by day of the week range from 1,165 for Monday to 1,270 for Wednesday. Indications are, on average:
- Most of U.S. stock market returns occur overnight.
- Overnight returns are on average stronger than intraday returns for all days of the week.
- The difference between overnight and intraday average returns is strongest on Tuesday (0.04%).
- Tuesday is relatively strong and both Thursday and, especially, Friday are relatively weak.
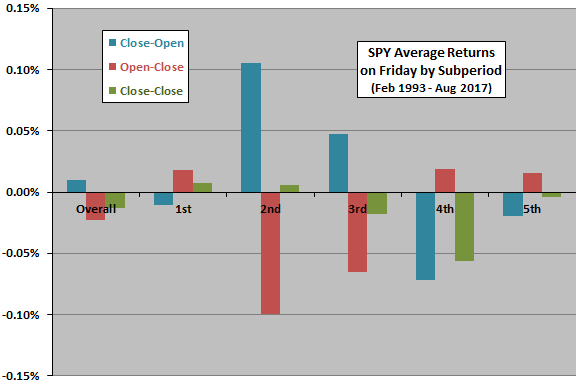
To check reliability of findings, we measure Friday returns by subperiod.

The next chart summarizes SPY average Close-Open, Open-Close and Close-Close returns on Friday for five equal subperiods of 247-248 observations each. The outperformance of overnight relative to intraday is not stable over time. The second (January 1998 through November 2002) and third (December 2002 through October 2007) subperiods drive the overall Friday result. During the first, fourth and fifth subperiods, average daytime returns are larger than average overnight returns.
Next, we segment returns according to the number of days since the prior close.

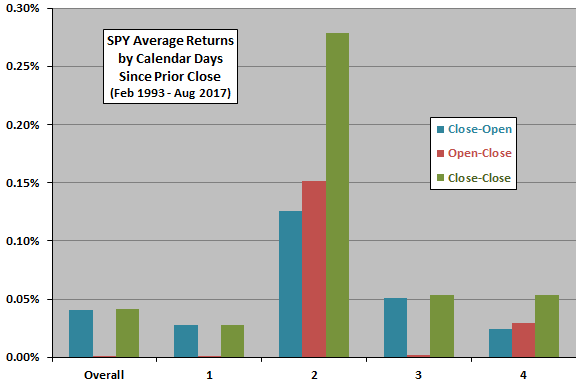
The next chart summarizes SPY average Close-Open, Open-Close and Close-Close returns overall and according to number of days since prior close over the available sample period. Number of days since prior close of:
- Indicates typical Tuesdays through Fridays (4,849 observations).
- Indicates a market holiday in the middle of the week (55 observations).
- Indicates a Monday after a typical weekend (1,121 observations).
- Indicates the day after a weekend extended by a Friday or Monday market holiday (225 observations).
We ignore three days after longer market closures. Indications are:
- For normal weekdays and normal weekends, most of U.S. stock market returns occur overnight.
- Market holidays disrupt this finding, with intraday returns on average a little stronger than overnight returns. However, these subsamples are relatively small.
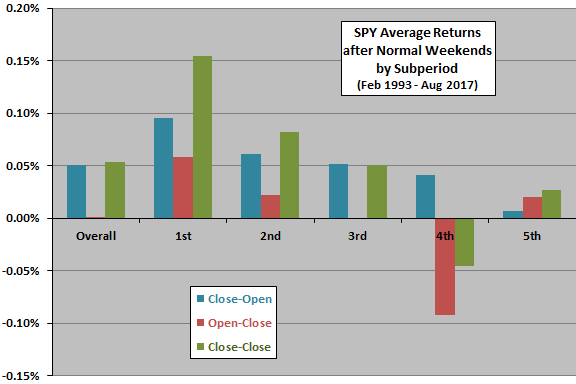
To check reliability of findings, we measure normal weekend returns by subperiod.

The final chart summarizes SPY average Close-Open, Open-Close and Close-Close returns on Monday after normal weekends for five equal subperiods of 224-225 observations each. Again, the outperformance of overnight relative to intraday is mostly consistent over time, but does not hold for the most recent subperiod.

In summary, evidence from simple tests offers some support for belief that overnight U.S. stock market returns tend to be stronger than intraday returns, but this effect is not stable across arbitrarily set subperiods.
Cautions regarding findings include:
- Effects are generally very small, and returns do not account for any trading frictions associated with exploitation.
- As noted, inconsistencies across subperiods (due to randomness or market adaptation) undermine belief in true tendencies.
- Interpretation of past average returns as the expectation for future returns assumes that return distributions are reasonably tame. Episodes of wildness may undermine this assumption.
For other perspectives on day-of-week effects, see:
- “Any Recent Day-of-the-Week Anomalies?”
- “Any Stock Market Anomalies Around 3-day Weekends?”
- “VXX and XIV Returns by Day of the Week”
- “VIX Day-of-the-Week Effects”
- “The Real Calendar Effects?”.
- “Overnight Momentum-informed Overnight Trading”
- “Anomalies by Day of the Week”
For other perspectives on intraday versus overnight returns, see: