“Stock Market and the National Election Cycle” examines the behavior of the U.S. stock market across the U.S. presidential term cycle (years 1, 2, 3 or 4) starting in 1950. Is a longer sample informative? To extend the sample period, we use the long run S&P Composite Index of Robert Shiller. The value of this index each month is the average daily level during that month. It is therefore “blurry” compared to a month-end series, but the blurriness is not of much concern over a 4-year cycle. Using monthly S&P Composite Index levels from the end of December 1872 through August 2019 (about 37.5 presidential terms), we find that:
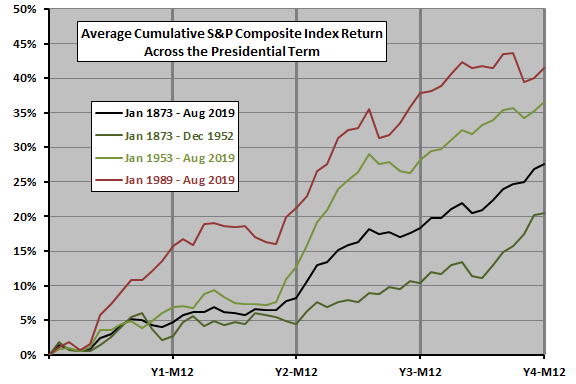
The following chart plots average cumulative return of the S&P Composite Index across the four years of the presidential term (Y1-Y4) for the full sample period based on monthly data (M12=December), and for the following subperiods:
- January 1983 through December 1952, preceding“Stock Market and the National Election Cycle”.
- January 1953 through August 2019, the same as “Stock Market and the National Election Cycle”.
- January 1989 through August 2019 for a recent snapshot.
The strong mid-term performance derives almost entirely from data after 1952, perhaps reflecting increasing federal government influence over business/market cycles. Accompanying this mid-term ascendancy is a decline in end-of-term strength, but the last six months of one year (2008) drive this decline.
For another perspective, we look at monthly rather than cumulative returns.
The next chart presents S&P Composite Index average returns by month across the presidential term during 1872-1952 and during 1952-present. This view confirms the change in interaction between political and market cycles.
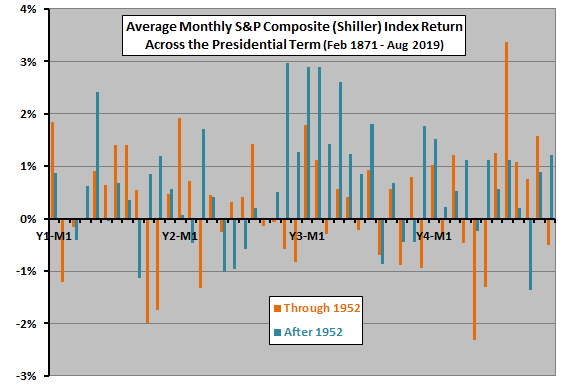
In summary, evidence from a long run sample suggests a mid-20th century shift toward abnormally strong U.S. stock market performance in the middle of presidential terms.
Cautions regarding findings include:
- The sample and especially subsamples for presidential term year analysis are not large, so confidence in related tendencies is modest.
- Trading frictions for strategies designed to exploit any tendencies would reduce returns.
See also “Monthly Returns During Presidential Election Years”.