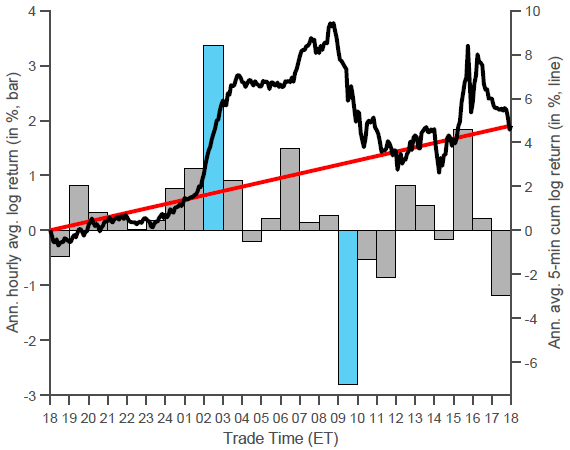
Has 24-hour trading of equity index futures created a reliable pattern in hour-by-hour returns? In their February 2020 preliminary paper entitled “The Overnight Drift”, Nina Boyarchenko, Lars Larsen and Paul Whelan study round-the-clock U.S. stock market performance decomposing S&P 500 Index futures returns by hour, with focus on dealer inventory management. Using 24-hour high-frequency trades and quotes for S&P 500 futures contracts during January 1998 through December 2018, they find that:
- In 2019, 15% ($15 billion per day) of trading in U.S. equity futures occurs overnight, with average annualized gross return during 1998-2018:
- 4.5% close-to-close.
- 3.1% close-to-open
- 1.4% open-to-close.
- More granularly (see the chart below), for E-mini S&P 500 futures:
- Average annualized gross return is 3.6% during the hour preceding the European regular trading open (2 a.m. to 3 a.m. ET, termed “overnight drift”). This effect is consistent across days of the week, months of the year and years in the sample. A strategy that each day holds E-minis only during 2 a.m. to 3 a.m. generates gross annualized Sharpe ratio 1.00. However, accounting for bid-ask spreads flips average return and Sharpe ratio negative.
- Average annualized gross return is -3.9% around the U.S. regular trading open (8:30 a.m. to 10 a.m. ET). This effect is largest on Thursdays and Fridays, suggesting reaction to macroeconomic and earnings announcements.
- The two effects have a weak positive correlation, so neither is a reversal of the other.
- There is a strong negative relationship between order imbalance at the end of normal trading hours and overnight drift at the open of European markets.
- In recent years dealers have increasingly corrected order imbalances at the open of Tokyo markets. This activity shifts by one hour when the U.S. switches between standard time and daylight savings time (Japan does not).
The following chart, taken from the paper, tracks for S&P 500 Index futures during 1998-2018:
- Average annualized return by hour (left axis and gray/blue columns).
- Average theoretical annualized cumulative return if information arrives continuously during the day and prices respond immediately (right axis and red line).
- Average annualized cumulative actual 5-minute return across the day (right axis and black line).
Notable points are:
- The positive blue column indicates extreme positive average return during 2 a.m. to 3 a.m., and the black line shows that gains during this hour are very steady. Adjacent hours are also positive
- The negative blue column indicates extreme negative average return during 9 a.m. to 10 a.m. ET, and the black line shows that losses during this hour are fairly steady. The next two hours are also negative.
- The positive gray column from 3 p.m. to 4 p.m. ET indicates positive average return at the close of regular trading.

In summary, evidence indicates that resolution of closing order imbalances drives an abnormally positive average U.S. stock market return during 2 a.m. to 3 a.m. ET, and there is an abnormally negative average return around the open of regular trading.
Cautions regarding findings include:
- As noted in the paper, the abnormally positive overnight drift is not readily exploitable on a net basis. However, findings may inform timing of trades made for other reasons.
- Also as noted in the paper, trading in Japan may be shifting findings.
For other items on overnight returns, see results of this search.