“Seasonal Strategy for QQQ?” finds an interesting even year-odd year effect in Invesco QQQ Trust (QQQ) annual returns. The Trading Calendar and “Monthly Returns During Presidential and Congressional Election Years” find notable differences in S&P 500 Index performances for even years and odd years. A plausible culprit is federal elections. Is this effect growing over time? To investigate, we look at four indexes over their full histories:
- Shiller’s S&P Composite Index during 1871 through 2024 (153 annual returns).
- The S&P 500 Index during 1927 through 2024 (97 returns).
- The NASDAQ 100 Index during 1985 through 2024 (39 returns).
- The Russell 200 Index during 1987 through 2024 (37 returns).
For each index, we calculate annual returns for even years and odd years and look at the separate trends in these returns over time. Using the selected end-of-year index levels, we find that:
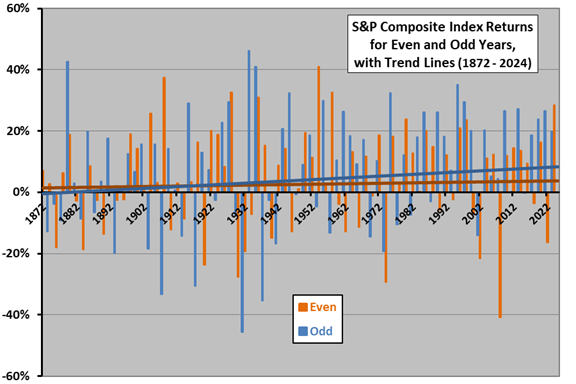
The following chart shows annual returns for the S&P Composite Index over its full history for even years and odd years separately, along with associated trend lines. Notable points are:
- Returns for even years show perhaps a slight upward trend.
- Returns for odd years show a clear increasing trend, with odd years becoming better than even years around the middle of the 20th century.
Next, we look at the S&P 500 Index.

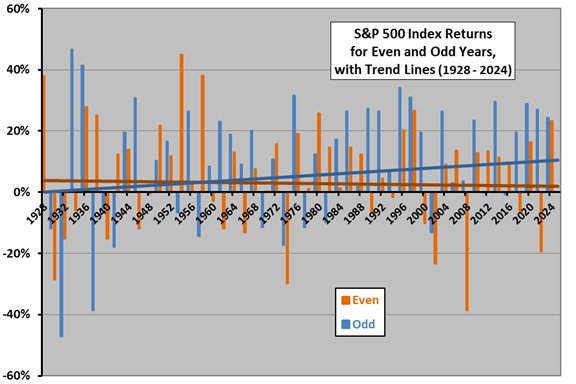
The next chart shows annual returns for the S&P 500 Index over its full history for even years and odd years separately, along with associated trend lines. Notable points are:
- Returns for even years show a modestly decreasing trend.
- Returns for odd years show an increasing trend, with odd years becoming better than even years about 1960.
Next, we look at the younger NASDAQ 100 Index for effects on technology stocks.

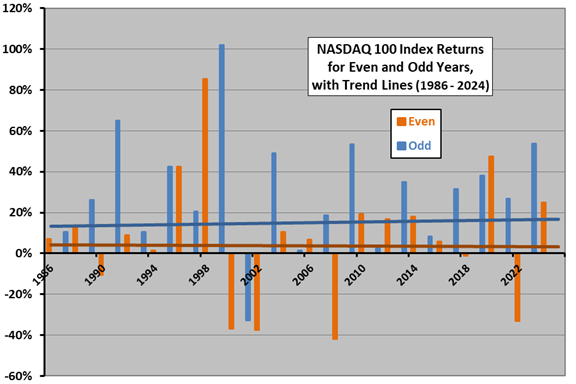
The next chart shows annual returns for the NASDAQ 100 Index over its full history for even years and odd years separately, along with associated trend lines. Notable points are:
- Returns for even years show low returns with perhaps a slight downward trend.
- Returns for odd years show high returns and a modestly increasing trend.
Next, we look at the slightly younger Russell 2000 Index for effects on small stocks.

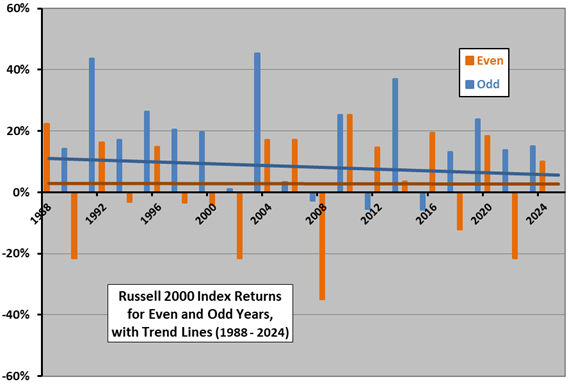
The final chart shows annual returns for the Russell 2000 Index over its full history for even years and odd years separately, along with associated trend lines. Notable points are:
- Returns for even years show low returns and no trend.
- Returns for odd years show high returns and a modestly decreasing trend.

For reference, the following tables summarize average annual returns (left table) and volatility of annual returns (right table) for all four indexes separately during even and odd years over the common 1988 through 2024 subperiod. Notable points are:
- Average returns are markedly stronger during odd years than even years.
- Annual return volatilities are lower during odd years than even years, so risk does not explain the higher odd-year returns.

In summary, evidence suggests a material and growing difference in returns for large-capitalization U.S. stock indexes between even (weak) and odd (strong) years. While the difference in returns exists for small stocks, it appears not to be growing.
A possible interpretation is that government-large firm interactions are growing over time, as are attendant effects of election uncertainties.
Cautions regarding findings include:
- Available samples are short to moderate, limiting confidence in findings.
- Average annual returns are still positive for all indexes during even years.
- As suggested by findings in referenced items, there may be some more precise demarcations of political effects than simple calendar years.
- The above analyses do not test any strategies to exploit findings, which would involve some frictions. High return volatilities complicate exploitation.