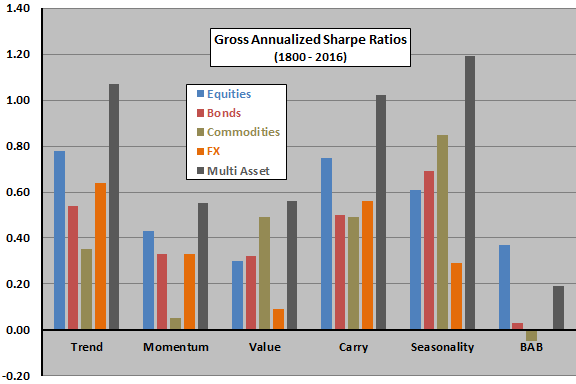
Do very old data confirm reliability of widely accepted asset return factor premiums? In their January 2019 paper entitled “Global Factor Premiums”, Guido Baltussen, Laurens Swinkels and Pim van Vliet present replication (1981-2011) and out-of-sample (1800-1908 and 2012-2016) tests of six global factor premiums across four asset classes. The asset classes are equity indexes, government bonds, commodities and currencies. The factors are: time series (intrinsic or absolute) momentum, designated as trend; cross-sectional (relative) momentum, designated as momentum; value; carry (long high yields and short low yields); seasonality (rolling “hot” months); and, betting against beta (BAB). They explicitly account for p-hacking (data snooping bias) and further explore economic explanations of global factor premiums. Using monthly global data as available during 1800 through 2016 to construct the six factors and four asset class return series, they find that:
- Based on gross Sharpe ratios, after accounting for data snooping bias, 1981-2011 replication test results are ambiguous.
- Raising the bar for statistical significance, only 10 of 22 (excluding seasonality for bonds and currencies) factor-class premiums are significant. Using Bayesian inference, only 8 of 22 premiums are significant.
- With uniform testing methodology and asset universe, only 8 of 24 premiums (including seasonality for bonds and currencies) achieve stringent statistical significance, and only 6 of 24 achieve Bayesian significance.
- An alternative Bayesian approach implies that investors should be extremely skeptical about 21 of 24 premiums.
- However, out-of-sample evidence based on gross Sharpe ratios supports strong belief in most of the factor-class premiums even after accounting for data snooping bias.
- Annualized gross Sharpe ratios are economically meaningful, averaging 0.41 (see the chart below).
- Imposing stringent statistical significance (using Bayesian inference), 19 of 24 (19 of 24) premiums are significant.
- Trend, carry and seasonality are strongest. BAB is an exception, present only in equity indexes.
- Except for trend and momentum, factor premiums are largely uncorrelated and thus mutually diversifying.
- Market, downside and macroeconomic risks do not drive factor premiums (the overall sample includes 43 years of bear markets and 74 years of economic recessions).
The following chart, constructed from findings in the paper, summarizes gross annualized Sharpe ratios during 1800-2016 for all six factors across all four asset classes, and for a “Multi Asset” portfolio that equally weights asset classes after first imposing a 10% annual volatility target. Trend, carry, and seasonality are generally the strongest, and BAB is the weakest.

In summary, evidence from gross Sharpe ratios over the very long run supports belief in significant worldwide trend, momentum, value, carry and seasonality factors across asset classes.
Cautions regarding findings:
- Findings are gross, not net. Findings based on net Sharpe ratios may differ. Specifically:
- Use of indexes rather than liquid assets ignores costs of, and impediments to, construction and maintenance of liquid tracking funds. These costs and impediments may be great during much of the very long sample period and may vary across countries.
- Trading frictions and shorting costs for factor portfolio rebalancing vary across factors and may be very high during parts of the sample period. The oldest data, in particular, may involve relatively illiquid markets. Shorting feasibility may vary across asset classes, across countries and over time.
- Tax consequences of trading vary considerably across countries and over time.
- Timely acquisition and processing of quality data may be problematic and costly for older data, varying across countries.