How does execution delay affect the performance of the Best Value and Weighted versions of the “Simple Asset Class ETF Value Strategy” (SACEVS)? These strategies each month allocate funds to the following asset class exchange-traded funds (ETF) according to valuations of term, credit and equity risk premiums, or to cash if no premiums are undervalued:
3-month Treasury bills (Cash)
iShares 20+ Year Treasury Bond (TLT)
iShares iBoxx $ Investment Grade Corporate Bond (LQD)
SPDR S&P 500 (SPY)
To investigate, we compare 22 variations of each strategy with execution days ranging from end-of-month (EOM) per the baseline strategy to 21 trading days after EOM (EOM+21). For example, an EOM+5 variation computes allocations based on EOM but delays execution until the close five trading days after EOM. We include a benchmark that each month allocates 60% to SPY and 40% to TLT (60-40) to see whether variations are unique to SACEVS. We focus on gross compound annual growth rate (CAGR), maximum drawdown (MaxDD) and annual Sharpe ratio as key performance statistics. Using daily dividend-adjusted closes for the above ETFs from the end of July 2002 through January 2020, we find that:
We ignore ETF trading (switching/rebalancing) frictions and any tax implications of trading, which would be about the same for all SACEVS variations. Since neither Best Value nor Weighted strategies allocates to Cash over the sample period, we ignore daily variations in the return on Cash.
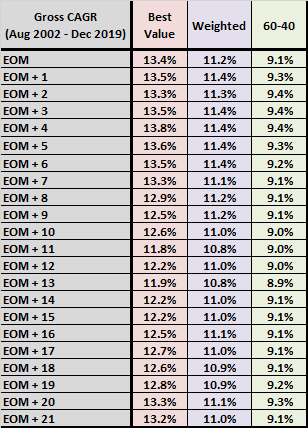
The following table compares CAGRs for the two SACEVS strategies and 60-40 across all variations of signal execution delay. Results are noisy, due in part to slight differences in start and stop dates, but do not indicate harm from delaying execution up to EOM+7.
What about MaxDDs?

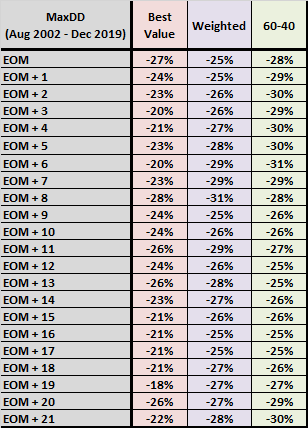
The next table compares MaxDDs for the two SACEVS strategies and 60-40 across all variations of signal execution delay. Results are again noisy, with modest variability, but do not indicate much harm from delaying execution.
What about annual Sharpe ratios?

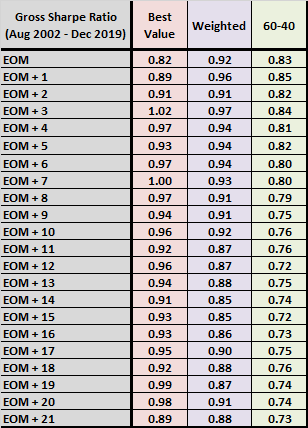
The next table compares annual Sharpe ratios for the two SACEVS strategies and 60-40 across all variations of signal execution delay. Results are noisy, with modest variability, suggesting that delaying execution is: (1) advantageous for Best Value; (2) not harmful up to EOM+11 for Weighted; and, disadvantageous for 60-40 after a few days.

In summary, evidence suggests that delaying SACEVS signal execution by a few days is more likely to help than harm performance.
Cautions regarding findings include:
- The sample period is short for determining differences in outcomes with confidence.
- Brute force experimentation introduces snooping bias, exacerbated by the noisiness of daily data. The performance of the best (worst) snooped variation tends to overstate (understate) expected performance.