Does crude oil (an important part of commodity indexes) exhibit an exploitable price seasonality? To check, we examine three monthly series:
- Spot prices for West Texas Intermediate (WTI) Cushing, Oklahoma crude oil since the beginning of 1986 (34+ years).
- Nearest expiration futures prices for crude oil since April 1983 (37+ years).
- Prices for United States Oil (USO), an exchange-traded implementation of short-term crude oil futures since April 2006 (14+ years).
We focus on average monthly returns by calendar month and variabilities of same. Using monthly prices from respective inceptions of these series through October 2020, we find that:
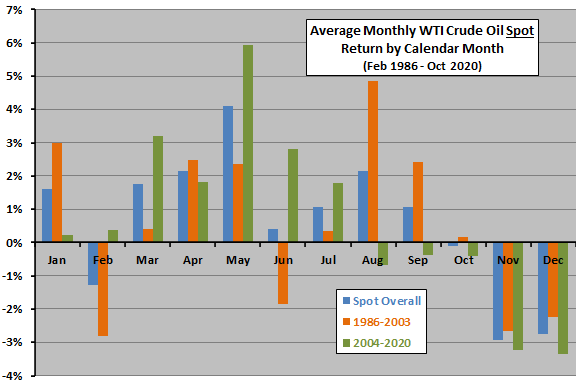
The following chart shows average WTI crude oil spot returns by calendar month over the full sample period and two equal subperiods. Average monthly return during 1986-2020 (2004-2020) is 0.61% (0.71%). Notable points are:
- Price tends to rise with consistency during March through May.
- Price tends to fall with consistency during November and December.
- Price is consistently unchanged during October.
For additional perspective, we look at standard deviations of returns by calendar month.
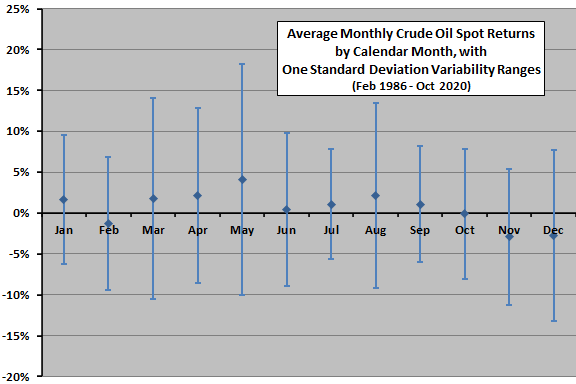
The next chart shows average WTI crude oil spot returns by calendar month over the full sample period, along with one standard deviation variability ranges. Notable points are:
- Variabilities are large compared to average returns, ranging from 6.7% to 14.2%, making average findings difficult to exploit.
- Variability is largest for May, March, August and December.
- Variability is smallest for July and September.
For a less noisy view, we zoom out to calendar quarters.
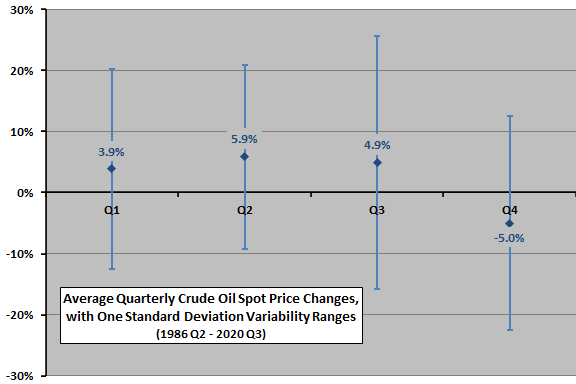
The next chart shows average WTI crude oil spot returns by calendar quarter over the full sample period, along with one standard deviation variability ranges. Notable findings are:
- The fourth quarter is very weak.
- The third quarter is especially volatile.
Spot returns are not directly exploitable by investors (commodity speculators). What about results for crude oil futures?
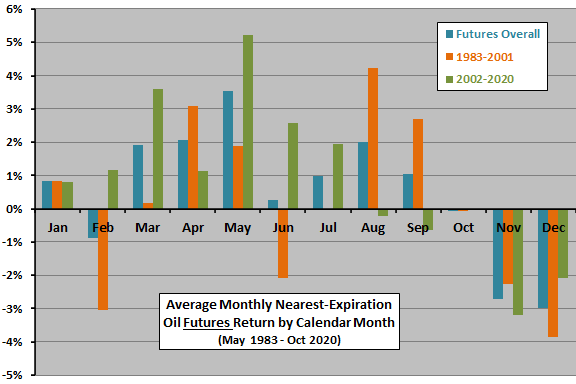
The next chart shows average WTI crude oil nearest futures returns by calendar month over the full sample period and two equal subperiods. Average monthly return during 1983-2020 (2002-2020) is 0.57% (0.88%). Results are very similar to those for spot prices.
For additional perspective, we look at standard deviations of returns by month.
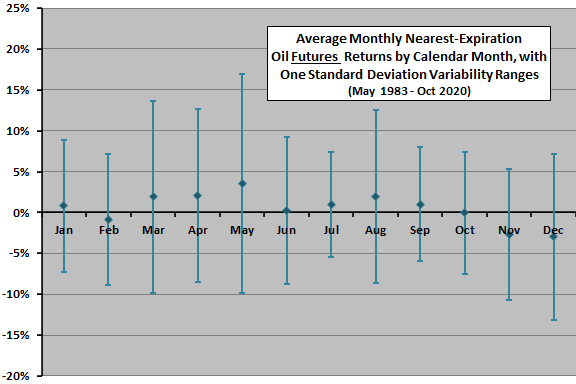
The next chart shows average WTI crude oil nearest futures returns by calendar month over the full sample period, along with one standard deviation variability ranges. Variability ranges are again large compared to average returns, such that average findings are difficult to exploit. Variability by month is again highest (lowest) for March, August and December (April, June, July and September), ranging from 6.5% to 13.4%.
Findings are somewhat more exploitable than those for spot price changes, but data do not account for the roll yield inherent in maintaining a continuous crude oil futures position.
How about the easily investable USO?
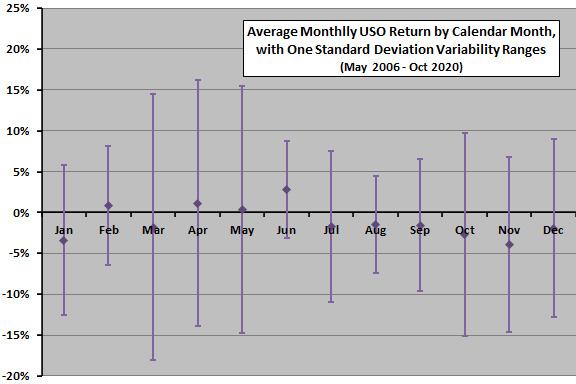
The next chart shows average USO returns by calendar month over the full sample period, along with one standard deviation variability ranges. Results are different from the above two longer series. Notable points are:
- Average returns are materially positive only for June and materially negative for July-January and March.
- Variability ranges are again large compared to average returns, such that average findings are difficult to exploit.
Finally, we directly compare results for the three price series.
The final chart compares average WTI crude oil spot returns, nearest futures returns and USO returns by calendar month over respective full sample periods. The most consistent findings is weakness in November and December. Easily tradable USO (focused on more recent data) is notably different from the longer underlying series for most months.
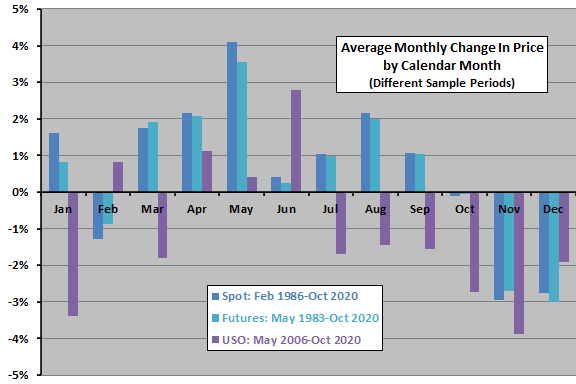
In summary, evidence from simple tests supports some belief that crude oil tends to have strong months (March-April) and, especially, weak months (November-December), but high variability inhibits exploitation.
However, USO traders relying on prior crude oil spot and futures calendar patterns are likely disappointed.
Cautions regarding findings include:
- Sample periods for all three series (emphatically for USO) are short for calendar-based analysis.
- As shown, crude oil returns are volatile, such that returns for a given year may differ dramatically from averages.
- To the extent that distributions of monthly returns are wild, average and standard deviation lose predictive meaning.
For energy sector seasonality, see “Sector Performance by Calendar Month”.