Does recent data suggest any reliable day-of-the-week U.S. stock market return anomalies? To investigate, we examine close-to-close stock market returns for the five trading days of the week, excluding trading days before and after market holidays and the day after the extended market disruption in September 2001. The intent of these exclusions is to suppress holiday effects on stock market returns. Using daily closing prices for the S&P 500 Index for 1981 through 2010 (7,301 daily returns, ranging from 1,382 Fridays to 1,546 Wednesdays), we find that:
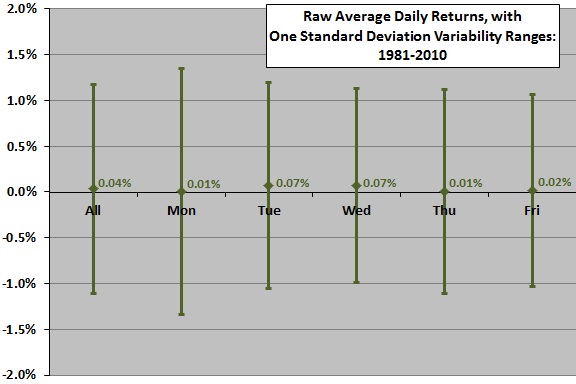
The following chart summarizes raw average S&P 500 Index daily returns for all trading days and for each day of the week over the entire sample period, with one standard deviation variability ranges. Results suggest that Tuesdays and Wednesdays are the good days, while Mondays, Thursdays and Fridays are the bad days. However, standard deviations of day-of-the-week returns range from 1.05% (for Fridays) to 1.35% (for Mondays), so variability tends to swamp averages.
Is the relative performance by day of the week consistent over time?

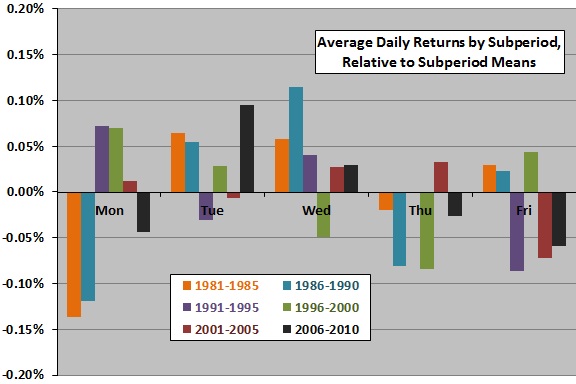
The next chart summarizes average daily S&P 500 Index returns for each day of the week during six consecutive five-year subperiods since the beginning of 1981, relative to the average daily return for respective subperiods. Inconsistencies in results for specific days of the week across the six subperiods undermine belief in reliable day-of-the-week anomalies.

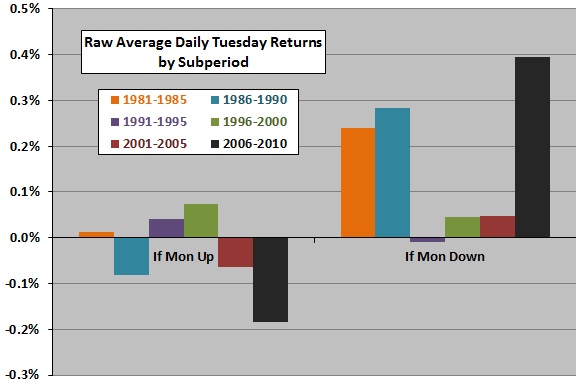
A reader asked whether Tuesdays tend to reverse Mondays. Over the entire sample period, if the raw Monday return is positive (negative), the average raw return for the subsequent Tuesday is -0.03% (0.18%). Is this apparent tendency for reversal consistent?
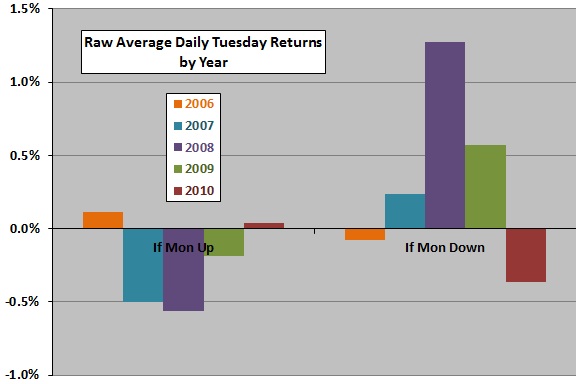
The final two charts show the average raw return on Tuesday following up and down Mondays during six consecutive five-year subperiods since the beginning of 1981 (upper chart) and during each of the past five years (lower chart). While Tuesday reversal of Monday is evident in the most recent five-year subperiod, inconsistencies across subperiods undermine belief in a reliable effect. Moreover, the reversal found in the most recent subperiod is not consistent across the five years of the subperiod.


In summary, evidence from simple tests on recent data offers little support for belief in exploitable day-of-the-week anomalies in U.S. stock market returns.