The Trading Calendar presents cumulative return visualizations for the S&P 500 Index across the calendar year and across each calendar month. Three alternative perspectives on U.S. stock market performance by calendar month are: (1) percentage of positive returns; (2) ratio of average return to standard deviation of returns; and, (3) distribution of returns. Using monthly returns for the S&P 500 Index during January 1928 through December 2019 (92 observations per month), we find that:
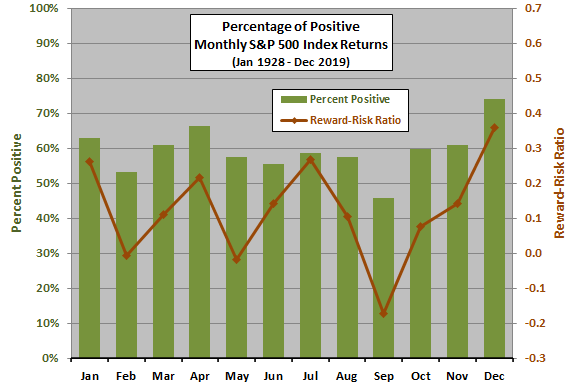
The following chart shows the percentage of S&P 500 Index returns that are positive and reward-to-risk ratio (average S&P 500 Index return divided by standard deviation of returns) by calendar month over the full sample period. Results suggest that September (December) is the worst (best) month for U.S. stock market investors.
For another perspective, we look at distributions of returns.

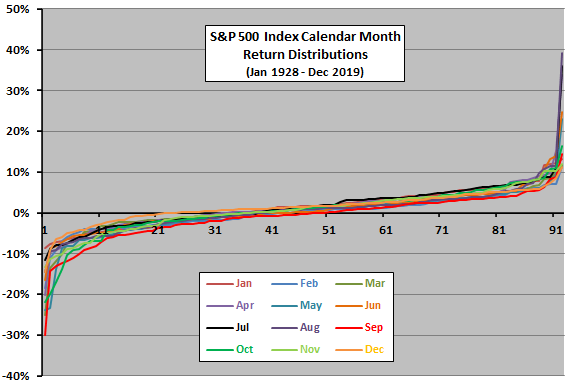
The next chart shows the distributions of S&P 500 Index returns for all 12 calendar months, each ordered from lowest (most negative) to highest (most positive). The horizontal axis is simply a cumulative count of observations (92 for each month). Results suggest close to even split between positive and negative returns and extreme returns in the left and right tails.
For interpretation, we look at moments of return distributions.

The following table summarizes average monthly return, standard deviation of monthly returns, ratio of average to standard deviation, skewness of monthly returns and kurtosis of monthly returns for the S&P 500 Index by calendar month over the full sample period. Notable points are:
- January, April, July and December are especially attractive from a reward-to-risk perspective.
- Skewness is negative (negative tails longer than positive tails) for seven of 12 months.
- Kurtosis is mostly positive (fat tails), and especially high for April, July and August, detracting from representativeness of average return.

In summary, evidence from calendar month return distributions suggests the possibility of seasonal tendencies for the U.S. stock market favoring the first month of the first three quarters and December.
Cautions regarding findings include:
- The S&P 500 Index does not include dividends (thereby understating returns). Nor does it account for any costs of creating a tradable asset from a changing membership of stocks.
- The above analyses are in-sample. An investor operating in real time may generate different statistics at different points during the sample period. The sample is not long enough for reliable out-of-sample testing.
- The above analyses test no trading strategies, which would involve trading frictions, thereby inhibiting exploitation of any anomalies.
See “Basic Equity Return Statistics” for statistics by decade rather than by calendar month.