Do the aggregate trading stimulants/habits of large players create short-term stock return patterns? In their June 2010 paper entitled “Are You Trading Predictably?”, Steven Heston, Robert Korajczyk, Ronnie Sadka and Lewis Thorson continue an investigation of daily patterns in stock returns by extending the sample period described in “Intraday/Daily Stock Return Patterns”. Using intraday bid and ask prices for 4,494 U.S. stocks spanning the post-decimalization period of January 2001 through December 2009 to calculate returns over 13 half-hour intervals each day, they find that:
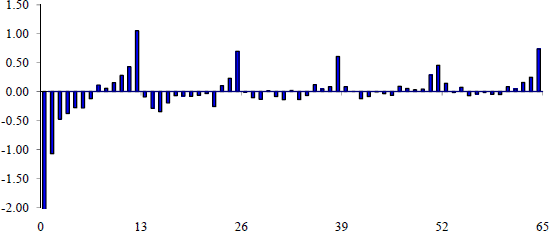
- Stocks which outperform the market in a given half-hour interval tend to exhibit rapidly decaying underperformance over the next several hours, followed by periodic outperformance in the same half-hour interval on subsequent days.
- This effect is notably stronger for the first and last half-hours of the trading day, but exists for all half-hour intervals.
- The effect is consistent across years in the sample period, except for a possible reduction in magnitude during 2009.
- Percentage changes in trading volume exhibit a similar pattern, but do not explain the return pattern.
- Trading exclusively on this pattern is unprofitable after trading friction. However, the magnitude of the pattern is sizeable relative to institutional commissions and effective spreads, so randomizing or (better) shifting trade timing to exploit the pattern could substantially reduce friction for frequent, low-cost traders.
The following chart, taken from the paper, summarizes the average relationship of returns (portfolio-level excess return in percent based on bid-to-bid and ask-to-ask) for 4,494 U.S. stocks during a given half-hour to returns for the same stocks during each of the next 65 half-hour intervals (five trading days) from January 2001 through December 2009. Results indicate average reversal over the first few hours (intervals 1-6) and continuation during the same interval on successive trading days (13, 26, 39, 52 and 65).

In summary, evidence suggests that frequent, low-cost traders may be able to offset part of trading frictions by exploiting daily patterns in stock returns.