Is there a straightforward way to model the returns on U.S. Corporate bond indexes? In his April 2019 paper entitled “Give Credit Where Credit is Due: What Explains Corporate Bond Returns?”, Roni Israelov models returns on these indexes based on four intuitive factors:
- Positive exposure to government bond yields, quantified via duration-matched government bonds.
- Negative exposure to rate volatility from bond call provisions (uncertainty in duration), quantified via delta-hedged options on 10-year Treasury note futures.
- Positive exposure to firm values due to default risk, quantified via index constituent-weighted equities.
- Negative exposure to firm stock volatility due to default risk, quantified via index constituent-weighted delta-hedged single-name equity options.
Exposures 1 and 2 are general (systematic), while exposures 3 and 4 contain both systematic and firms-specific (idiosyncratic) components. He tests this 4-factor model on six Bank of America Merrill Lynch U.S. corporate bond indexes: Investment Grade, High Yield, 1-3 Year Corporate, 3-5 Year Corporate, 5-10 Year Corporate, and 10+ Year Corporate. All duration-specified indexes are investment grade. He also tests two Credit Default Swap (CDS) indexes: investment grade and high yield. He further devises and tests a Risk-Efficient Credit strategy on the six bond indexes that isolates and exploits compensated risk premiums by buying bond index futures, buying equity index futures, selling delta-hedged equity index options and selling delta-hedged options on bond index futures, with allocations sized to match respective historical exposures of each index. Using monthly data for the eight bond/CDS indexes and the four specified factors and their components during January 1997 through December 2017, he finds that:
- Annualized gross Sharpe ratios for the six bond and two CDS indexes range from 0.4 to 0.7.
- The 4-factor model specified above explains 59% to 76% of return variance across the six bond indexes (51% and 54% for the two CDS indexes). Average unexplained returns for bond indexes are not statistically significant.
- Regarding decomposed sources of bond index returns and risks (isolating systematic and idiosyncratic components of factors 3 and 4 above):
- Exposures to government bonds, equity markets, S&P 500 Index convexity and bond convexity are significant sources of risk, and contribute positively to returns. For example, these exposures contribute 7.1% gross annual return with 4.8% annualized volatility to the Investment Grade Corporate Bond Index.
- Widely used firm-specific equity factors (size, value, momentum, betting against beta and quality) contribute only 0.1% gross annual return with 0.6% annualized volatility to the Investment Grade Corporate Bond Index.
- Other idiosyncratic components contribute -3.6% gross annual return with 3.6% annualized volatility to the Investment Grade Corporate Bond Index.
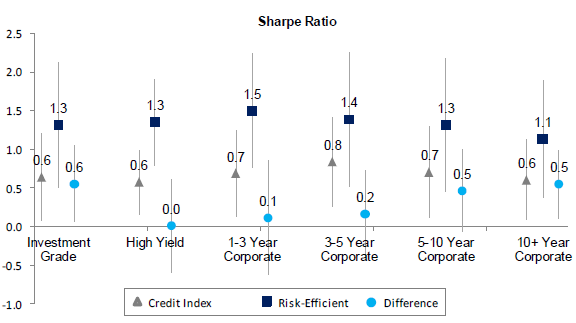
- The Risk-Efficient Credit strategy generates higher average gross returns than corporate bond index counterparts, with lower volatilities, higher gross Sharpe ratios (see the chart below) and shallower drawdowns.
The following chart, taken from the paper, compares gross annualized Sharpe ratios of the six corporate bond (credit) indexes with those of the Risk-Efficient Credit strategy applied to each respectively. The first five years of data specify initial weights for the Risk-Efficient Credit strategy, with subsequent weights estimated monthly from an expanding historical window during during January 2002 through December 2017. The chart also indicates differences in Sharpe ratios between the two series and 95% confidence intervals for each reading. Gross Sharpe ratios of the Risk-Efficient Credit strategy are uniformly higher than those of respective bond indexes (1.1 to 1.5 versus 0.6 to 0.8).

In summary, evidence indicates that investors may be able to construct a portfolio of bond index futures, equity index futures, equity index options and options on bond index futures that significantly outperforms associated bond indexes.
Cautions regarding exposures include:
- Modeled returns are gross, not net.
- For bond indexes, costs of maintaining liquid tracking funds would reduce returns.
- For Risk-Efficient Credit strategy portfolios, costs of monthly portfolio reformations would reduce returns and may affect findings.
- Some analyses are in-sample, assuming knowledge of full bond index histories.
- Risk-Efficient Credit strategy portfolio specification and execution is beyond the reach of many investors, who would bear fees for delegating to a fund manager.
- As noted by the author, simplifying assumptions in the model of corporate bond index returns work against precise implementation.