Does the term premium as measured by returns to zero-coupon U.S. Treasury notes (T-notes) concentrate during some part of the monthly cycle? In their August 2019 paper entitled “Predictable End-of-Month Treasury Returns”, Jonathan Hartley and Krista Schwarz examine the monthly cycle of excess returns on 2-year, 5-year and 10-year T-notes. Specifically, they calculate average excess return by trading day before end-of-month (EOM), with excess return measured as raw T-note return minus general collateral repo rate. Using modeled daily prices for the specified T-notes and daily general collateral repo rate during January 1990 through December 2018, they find that:
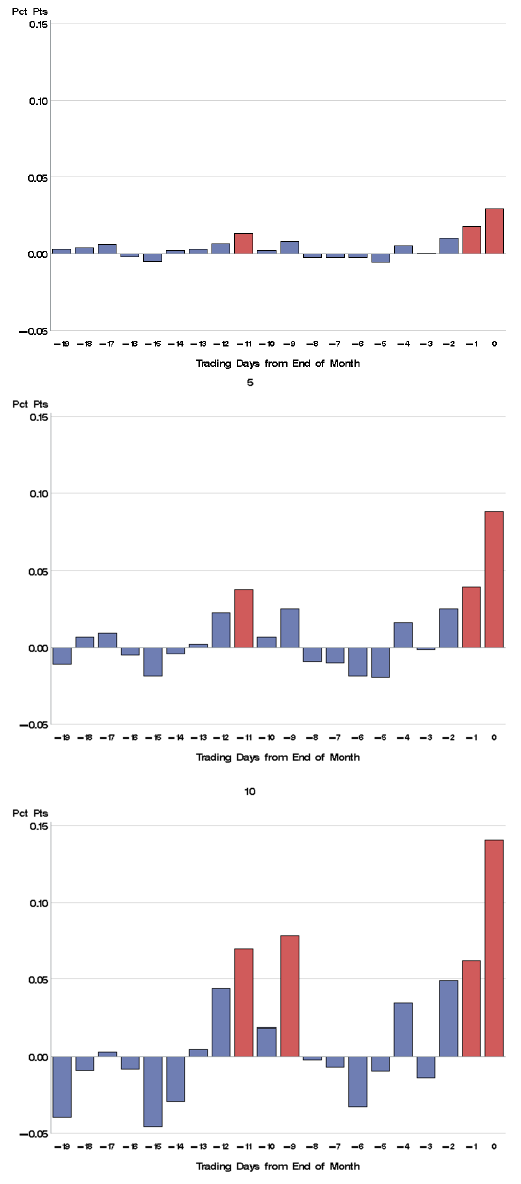
- Across maturities, average gross excess T-note returns are positive and highly significant for the last three to five trading days of the month, and are not significantly different from zero for other days (see the charts below).
- For example, average gross excess return for the 10‐year T-note over the last three trading days of the month is 0.25% (3% annualized). The distribution of these 3-day returns has positive skewness (does not exhibit crashes).
- This EOM effect increases with maturity.
- Corresponding gross annualized Sharpe ratios are around 1.0, with highest values for 2-year and 5-year T-notes over the last two or three trading days of the month.
- T-note bid-ask spreads are typically 0.02% to 0.03%, so trading frictions are small compared to average gross excess return for 10-year T-notes. For shorter maturities, frictions make a bigger dent.
- Results for a 2015-2018 subperiod are weaker but still statistically significant, raising the possibility of market awareness/adaptation.
- Tests on actual most recently issued T-notes and T-bonds generally confirm findings, with the EOM effect concentrating the last trading day of the month. Tests on Treasury futures and interest rate swaps confirm a spillover effect.
- The EOM effect for T-notes is attributable to fund/institution window dressing and portfolio rebalancing.
The following charts, taken from the paper, summarize average excess returns in percent as modeled for 2-year (top), 5-year (middle) and 10-year (bottom) zero-coupon T-notes by trading day from the end of the month. Day 0 is the last trading day of the month. The charts show the exceptionally large gross excess return on the final trading day of the month across maturities. There are smaller, but still statistically significant gross excess returns on the next-to-last trading day of month and in mid-month.

In summary, evidence indicates that term premium concentrates in the last few trading days of the month.
Cautions regarding findings include:
- Test methods used in the paper are not accessible to most investors, who would bear fees for delegating to a fund manager.
- Findings for iShares Barclays 20+ Year Treasury Bond (TLT) since mid 2002 in “Does the Turn-of-the-Month Effect Work for Asset Classes?” do not corroborate findings in the paper.
- Noisiness of findings indicate risk of data snooping bias in the optimal monthly cycle/maturity combination, such that results overstate expectations.