How connected are principal measures of U.S. economic activity and U.S. stock market performance? In their October 2020 paper entitled “Has the Stock Market Become Less Representative of the Economy?”, Frederik Schlingemann and René Stulz model and measure relationships between market capitalizations of U.S. publicly listed firms and their contributions to U.S. employment and Gross Domestic Product (GDP). They estimate employment contribution directly based on firm reports, with modeled adjustments. They measure contribution to GDP based on firm value-add, approximated as operating income before depreciation plus labor costs (with labor costs often modeled). They also try other ways of measuring value-add. Using annual non-farm employment and GDP data for the U.S., annual employment and value-add data for U.S. publicly listed firms and annual stock prices for those firms during 1973 (limited by firm employment data) through 2019, they find that:
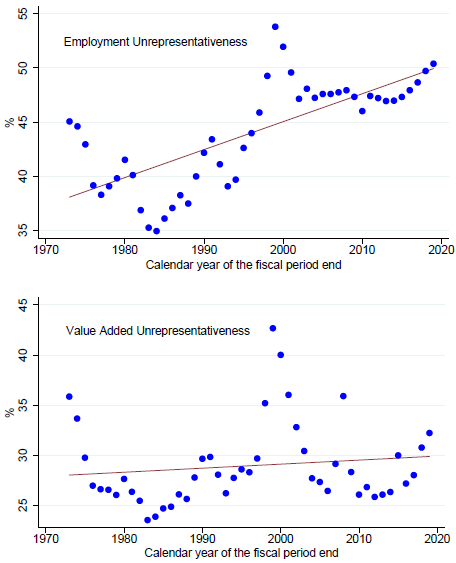
- From 1973 to 2019, the percentage of employees working for public firms falls from 41.4% of non-farm, private sector workers to 29.0%. The stock market is more unrepresentative at the end of the sample period with respect to employment than at all times except around the year 2000 (see the first chart below). For most years during the 1970s and early 1980s (three of four years during 2016-2019), firm employment explains more than 50% (less than 20%) of variation in market capitalizations.
- Contribution of public firms to GDP is higher in the 1970s than in the 2000s across different measures of value-add. The variation in value-added explains the variation in market capitalization less well at the end of the sample period than in a number of years, but it explains it better than during 1988-2003 (see the second chart below). Adjusting income for investment in intangible assets does not affect findings.
- Major reasons for these trends are decline of manufacturing and growth of services, with service firms less likely to be publicly listed. The number of manufacturing employees declines by over 30% over the sample period, despite substantial growth of the overall economy.
- Representativeness is worst when the stock market is most highly valued, as measured by Robert Shiller’s Cyclically Adjusted Price-to-Earnings (CAPE or P/E10).
The following charts, taken from the paper, plot the evolution of employment unrepresentativeness (upper chart) and value-add unrepresentativeness (lower chart) for U.S. public firms over the full sample period. Unrepresentativeness is the average percentage absolute difference between firm market capitalization weight and its employment or value-add weight across all listed firms. Rise in unrepresentativeness is more convincing for employment than for value-add/GDP.

In summary, evidence indicates that the U.S. stock market capitalization is less related to the economy now than for most of the past 50 years.
In other words, studies of stock market-economy relationships based on historical data likely overstate findings as applied to current conditions.
Cautions regarding findings include:
- As noted in the paper, modeling requires multiple approximations.
- The study does not address using economic variables to predict stock market behavior.