Careful assessment of the exploitability of premiums or anomalies derived from long-run series such as stock indexes requires consideration of contemporaneous trading frictions. How have frictions changed over time? In the May 2002 version of his paper entitled “A Century of Stock Market Liquidity and Trading Costs”, Charles Jones assembles annual long-run series of three components of aggregate liquidity: (1) proportional bid-ask spreads for large-capitalization NYSE stocks (1900-2000); (2) proportional commissions for NYSE stocks (1925-2000); and, (3) turnover for NYSE stocks (1900-2000). He applies these series to explore the relationship between stock market returns and aggregate liquidity over time. Using a range of sources to calculate bid-ask spreads for the Dow Jones/DJIA stocks and commission, volume and return data for a broader sample of NYSE stocks, he finds that:
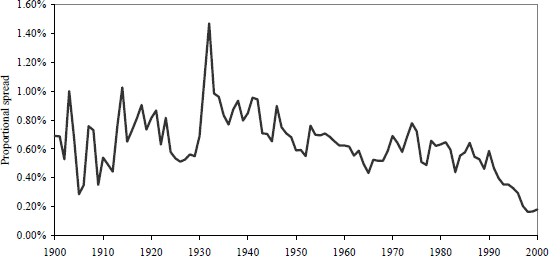
- The average proportional bid-ask spread on large-capitalization U.S. stocks generally declines over the past century, punctuated by sharp rises somewhat associated with bear markets. The spread has fallen dramatically over the last 20 years. (See the first chart below.)
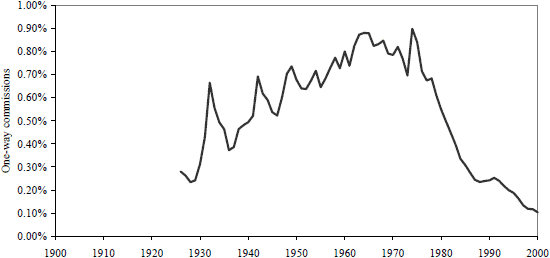
- The average proportional one-way broker commission for NYSE stocks peaks at nearly 1% in the late 1960s and early 1970s, and then falls sharply after commission deregulation in 1975. (See the second chart below.)
- Annual turnover of NYSE stocks varies widely over time. It exceeds 200% in the early years of the 20th century, falls to single digits during and after the Great Depression and increases steadily thereafter to 88% in 2000, with a local maximum of 73% in 1987.
- Total proportional one-way trading friction (half the above bid-ask spread plus the above one-way commission) is an average 0.84% during 1925-2000, but is below 0.50% since 1991 (as in the late 1920s). This friction is at least 1.00% for all of 1953 through 1975. It seems unlikely that an investor could have profitably executed trading-intensive strategies over much of the last century, especially strategies that involve stocks less liquid than the large-capitalization stocks considered above.
- The combination of bid-ask spreads, commissions and annual turnover suggests that the gross equity premium is perhaps 1% lower today than it was in the early 1900s.
- The annual average bid-ask spread (turnover) relates positively (negatively) to future annual stock returns at horizons of up to three years. Predictive power is greater for small-capitalization stocks than large-capitalization stocks.
- Changes in trading frictions relate positively to dividend yield (correlation 0.71), indicating that changes in trading frictions may account for some of the observed variation in the yield.
The following chart, taken from the paper, graphs the equal-weighted average proportional bid-ask spread (bid-ask spread divided by bid-ask midpoint) for Dow Jones stocks ((all Dow Jones stocks for 1900-1928 and DJIA stocks for 1929-2000). This spread is more volatile in the first third of the century, increasing or decreasing by as much as 0.40% in a single year. The spread has fallen dramatically to historically low levels over the last 20 years, with decimalization of quotes a factor. Spikes in the spread often coincide with or closely follow market downturns, but the relationship is imperfect. The correlation between annual excess stock return and same-year proportional spread is -0.24, indicating a tendency for proportional trading friction to be elevated when stock prices are low.

The next chart, also from the paper, shows the weighted average proportional one-way round-lot commission for NYSE trades based on the fixed schedule for 1925-1968 and exchange member commission revenue thereafter. This commission peaks at 0.88% in 1964 and 1965 and again (with a bear market) at 0.90% in 1974, before falling dramatically by about half every seven or eight years since.

In summary, trading frictions for large-capitalization U.S. stocks are much higher for most of the 20th century than they have been over the past 20 years. These frictions may be material in deriving exploitable trends or anomalies from long-run series.
Proportional trading frictions may vary considerably across asset classes, delineated by asset type (equities, bonds, commodity futures, hedge funds…), equity subsets (small-large, value-growth, sector…), geography (country, region, developed-emerging…) and bond subsets (government, corporate, high-yield…). Such variation in trading frictions could disrupt asset class diversification and anomaly-based trading strategies derived from analysis of long-run frictionless index data.