Can investors count on stock markets reverting to some valuation benchmark? In their March 2010 paper entitled “Mean Reversion in International Stock Markets: An Empirical Analysis of the 20th Century”, Laura Spierdijk, Jaap Bikker and Pieter van den Hoek analyze reversion of 17 developed country stock market indexes to a valuation benchmark based on a world stock market index. Using annual index data spanning 1900-2008 (109 years), they find that:
- On average over the entire sample period, stock markets eliminate half of a divergence from the valuation benchmark in about 13.8 years, with 95% confidence interval 10.1 years to 21.1 years.
- However, there are large variations in the speed of reversion among 83 rolling 27-year subperiods (length selected for comparison with past research), with average time to eliminate half of a divergence ranging from 2.1 years to a 23.8 years.
- The fastest reversion occurs for subperiods including the Great Depression and the start of World War II.
- Relatively fast reversion also occurs for the subperiods including the early years of the Cold War and subperiods including the Oil Crisis of 1973, the Energy Crisis of 1979 and Black Monday in 1987.
- In a substantial number of subperiods, no significant reversion to the valuation benchmark occurs.
- Results suggest that the speed at which stock markets revert to fundamental value is faster in times of high economic uncertainty caused by major economic and political events.
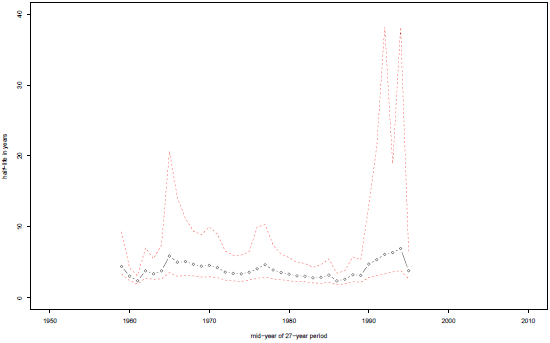
The following chart, taken from the paper, shows variation in the average time for 17 developed country stock markets to eliminate half of a divergence from the world stock market index (half-life) for 27-year subperiods covering 1946 through 2008. The black line represents the average half-life plotted at the midpoints of the 27-year subperiods. The dashed red lines plot the corresponding upper and lower bounds of 95% confidence intervals for these half-lives. A larger half-life indicates slower reversion to benchmark.
Results indicate that the speed of resolving divergences from the benchmark index varies substantially across subperiods and that the uncertainty in speed of reversion increases markedly when reversion is slow.

In summary, evidence of stock market reversion to a valuation benchmark, and the speed of any reversion detected, derive substantially from the choice of sample period.
In other words, evidence indicates that speed of reversion of stock markets to a valuation benchmark is not reliable over an investing lifetime.
The abstract approach used in the study is somewhat like measuring the speed of price convergence for pair trading.