Analyses such as those described in “Demographic Headwind for U.S. Stock Market?” and “Classic Research: Demography and the Stock Market” assess the impact of demographic changes on the stock market by focusing on market valuation as measured by price-earnings ratio (P/E). What story would a more direct analysis of demographics and stock market returns tell? To investigate, we: (1) collect historical U.S. age demographics; (2) construct an annual series of the ratio of middle-age cohort (ages 40–49) population to the old-age cohort (ages 60–69) population (designated M/O, similar to the metric described in “Demographic Headwind for U.S. Stock Market?”) to capture the joint behavior of presumed equity investors and equity disinvestors; and, (3) relate M/O to annual U.S. stock market returns. Using estimated annual (July 1) age demographics for 1900-2009, 2010 census age demographics, annual S&P 500 Index returns (June 30 to June 30) for 1950 through 2011, annual Dow Jones Industrial Average (DJIA) returns (June 30 – June 30) for 1929 through 2011 and annual Consumer Price Index (CPI) data (June) for 1913 through 2011, we find that:
Note that age demographics from linked sources are by age (for example, 65 years old) for 1900-1989 and by 5-year range (for example, 65-69 years old) for 1990-2010.
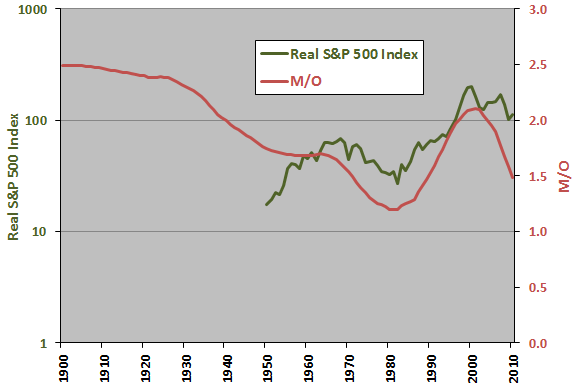
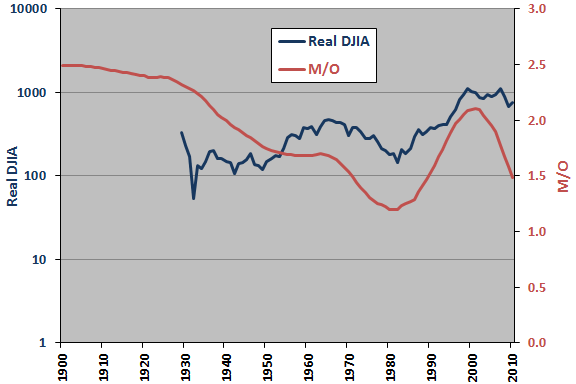
The following two charts compare the real S&P 500 Index (inflation-adjusted to 1950) to M/O (upper chart) and DJIA (inflation-adjusted to 1929) to M/O (lower chart) over available sample periods. Results suggest that the U.S. stock market and the selected demographic metric engaged roughly in step about 1970. Conversely, they are not clearly in step from about 1930 to 1970.
For greater precision we relate annual stock market returns to annual changes in M/O.


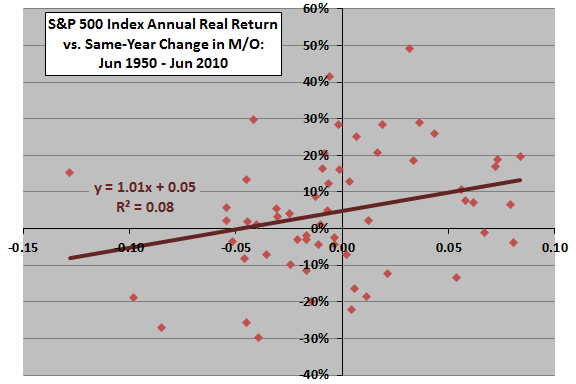
The following scatter plot relates S&P 500 Index annual real returns (June 30 to June 30) to same-year changes in M/O over the available sample period. The Pearson correlation for the two series is 0.28 and the R-squared statistic 0.08, indicating that annual change in M/O explains about 8% of the variation in annual stock market returns. The plot also shows the formula for a best-fit line that relates annual stock market return to same-year change in M/O. Note that:
- The Pearson correlation for the two series is 0.33 (0.29) for the first (second) half of the available sample period.
- Results for S&P 500 Index annual nominal returns (not shown) are similar, with R-squared statistic also 0.08.
- Results for DJIA annual real returns over the longer available sample period (not shown) are weaker, with R-squared statistic 0.03. Results for DJIA annual real returns during 1929-1969 indicate no relationship, with R-squared statistic 0.00.
To forecast stock market returns, we use census data to project future values of M/O and apply the formula for the historical best-fit regression line.

Data for younger cohorts from census 2010 age demographics enable forecasting M/O at five-year and ten-year horizons, as follows:
- The ratio of the ages 35–44 cohort population to the ages 55–64 cohort population in 2010, 1.13, provides an estimate of M/O for 2015.
- The ratio of the ages 30–39 cohort population to the ages 50–59 cohort population in 2010, 0.96, provides an estimate of M/O for 2020.
Crudely assuming a linear path for M/O over each of the two five-year future intervals generates estimated annual declines in M/O of -0.07 and -0.03 for 2011-2015 and 2016-2020, respectively. Applying the formula in the preceding chart to these changes in M/O indicates S&P 500 Index real returns for June 30 to June 30 of -2.5% (+1.5%) during 2011-2015 (2016-2020).
Note that the estimated 2011 real return of about -2.5% compares with actual real return of 23.7%. Obviously, there are other influences at work than demographics, but it is an inauspicious initial prediction.
In summary, evidence from simple tests suggests that U.S. demographic changes will have a negative influence on U.S. stock market returns over the next few years.
Cautions regarding findings include:
- As noted above, U.S. stock market returns and demographic changes appear to be unrelated before about 1970, undermining belief in a consistent connection. If demographic behaviors vary across generations because of changing lifetime experiences and changing socioeconomic environments, the sample may be much too small for useful inference.
- As noted in in “Demographic Headwind for U.S. Stock Market?”, there may be material data snooping bias in the selected demographic ratio.
- The 2010 M/O value may be out-of-synch with respect to the rest of the series (not a July 1 value).