What is the best way to put strategic edges and tactical views into investment portfolios? In their March 2018 paper entitled “Model Portfolios”, Debarshi Basu, Michael Gates, Vishal Karir and Andrew Ang describe and illustrate a three-step optimized asset allocation process incorporating investor preferences and beliefs that is rigorous, repeatable, transparent and scalable. The three steps are:
- Select a benchmark portfolio matched to investor risk tolerance via simple combination of stocks and bonds. They represent stocks with a mix of 70% MSCI All World Country Index and 30% MSCI USA Index. They represent bonds with Barclays US Universal Bond Index. In their first illustration, they focus on 20-80, 60-40 and 80-20 stocks-bonds benchmarks, rebalanced quarterly.
- Construct a strategic portfolio with the same expected volatility as the selected benchmark but generates a higher long-term Sharpe ratio by including optimized exposure to styles/factors expected to outperform the market over the long run. Key inputs are long-run asset returns and covariances plus a risk aversion parameter. In their first illustration, they constrain the strategic model portfolio to have the same overall equity exposure and regional equity exposures as the selected benchmark.
- Add tactical modifications to the strategic portfolio by varying strategic positions based on short-term expected returns and risks. In their second illustration, they employ a 100-0 stocks-bonds benchmark consisting of 80% MSCI USA Net Total Return Index and 20% MSCI USA Minimum Volatility Net Total Return Index. The corresponding strategic portfolio reflecting long-term expectations is an equally weighted combination of value, momentum, quality, size and minimum volatility equity factor indexes. They specify short-term return and risk expectations based on four indicators involving: economic cycle variables; aggregate stock valuation metrics; factor momentum; and, dispersion of factor measures (such as difference in valuations between value stocks and growth stocks). They apply these indicators to underweight or overweight strategic positions using an optimizer. They rebalance these portfolios monthly.
For their asset universe, they focus on indexes accessible via Exchanged Traded Funds (ETFs). Using monthly data for five broad capitalization-weighted equity indexes, six broad bond/credit indexes of varying durations and six style/factor (smart beta) equity indexes as available during January 2000 through June 2017, they find that:
- For the first illustration of strategic portfolio construction:
- Gross annualized returns (volatilities) of benchmark portfolios range from 5.4%( 4.3%) for 20-80 stocks-bonds to 5.6% (12.3%) for 80-20.
- Strategic recastings of the benchmarks boost gross annualized returns from 5.4% to 5.6% for 20-80 and from 5.6% to 6.0% for 80-20. However, during January 2007 to April 2009, strategic portfolios underperform their benchmarks.
- Active strategic tilts within stocks are toward quality, momentum and smaller stocks. Active bond index weights differ from the benchmark due to optimal duration risk balancing.
- For the second illustration of tactical portfolio construction:
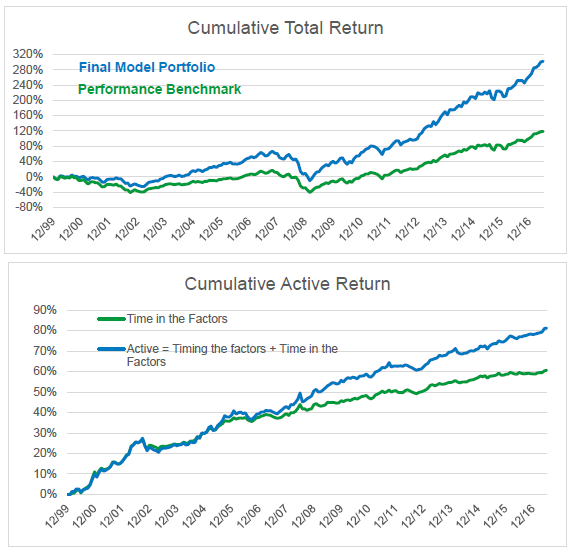
- The tactical portfolio generates average gross annual return 8.9%, outperforming the benchmark by 3.4% per year (see the first chart below).
- Outperformance of the tactical portfolio derives from (see the second chart below):
- Strategic tilts toward five stock factor indexes via equal weighting, adding on average 2.7% gross return per year to the benchmark with only 2.5% additional annual volatility.
- Tactical factor timing, adding on average 0.7% gross return per year to the strategic portfolio with 1.1% additional annual volatility.
The following charts, taken from the paper, track gross outperformance of the tactical portfolio (Final Model Portfolio) versus the benchmark (Performance Benchmark) as specified in the second illustration above over the full sample period. Average annual returns are 8.9% for the former versus 5.5% for the latter (upper chart). Gross average outperformance of 3.4% per year (lower chart) derives from both strategic tilts toward five stock factors (Time in the Factors, contributing 2.7% per year) and tactical timing of exposures to these factors (contributing 0.7% per year).

In summary, evidence from tests on stock and bond indexes suggests that investors can beat market benchmarks on a gross basis by a few percent annually via strategic factor tilts and tactical factor timing.
Cautions regarding findings include:
- The sample period of 16.5 years is not long in terms of number of economic and financial market cycles, so reliability of findings is not high.
- As noted in the paper, indexes are not investable and do not account for costs of tracking them (management fees and periodic rebalancing of components and, if specified, shorting of stocks) with liquid ETFs or for feedback to the market from the existence of such ETFs. See, for example:
- Costs of quarterly or monthly rebalancing of all portfolios would debit performances. Rebalancing costs may be higher for active (strategic and tactical) portfolios, thereby reducing or eliminating outperformance relative to benchmarks.
- Selection of factors may derive from research on data falling partly within the test period for this study, such that findings are partly in-sample. Moreover, prior research identifying the selected factors may impound data snooping bias, such that the current study inherits this bias.
- Optimization processes as employed in the strategic and tactical allocation illustrations generally have construction and parameter value choices that offer further opportunities for data snooping.
- The approach does not suppress 2007-2009 benchmark drawdowns.