Are there recognizable country and global financial cycles over the past half century? If so, what are their characteristics? In their April 2011 paper entitled “Financial Cycles: What? How? When?”, Stijn Claessens, Ayhan Kose and Marco Terrones employ regression models to investigate cycles in credit, housing and equity markets for developed countries since 1960. They define a downturn as peak to trough and an upturn as trough to level of previous peak (not trough to new peak). They define series peaks and troughs with the constraints that complete cycle duration must be at least five quarters and each upturn and downturn must be at least two quarters. The main characteristics of cyclical phases are their duration, amplitude and slope, with crunches/busts (booms) defined as downturns (upturns) in the bottom (top) fourth of all observations. They examine pre-globalization (1960-1985) and globalization (1986-2007) subperiods, with phases globally synchronized (highly synchronized) when more than 40% (50%) of countries experience the same phase. Using quarterly data for aggregate loans to the private sector, house/land price indexes and value-weighted stock market indexes for 21 developed countries over the period 1960 through 2007, seasonally adjusted as necessary, they find that:
- Over the entire sample period, there are 473 complete financial cycles, with over half associated with volatile equity markets. Equity (credit and housing) market cycles are more frequent than (comparable in frequency to) business cycles.
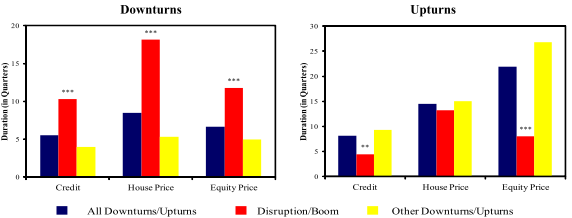
- Financial cycle downturns tend to have sharp declines in short periods and typically last five to eight quarters, while upturns typically last eight to 22 quarters (see the first pair of charts below).
- Housing and equity market cycles tend to be longer and more pronounced than credit market cycles, but equity cycles compress over time.
- Over the entire sample period, typical credit, housing and equity market downturns are about 4%, 6% and 24%, respectively.
- Over the entire sample period, there are 28 credit crunches, 28 housing market busts and 61 equity market busts. Compared to typical downturns, crunches/busts tend to be:
- Twice as long (18 quarters for the housing market and 10-12 quarters for credit and equity markets).
- About four times, seven times and two times deeper for credit, housing and equity markets, respectively .
- More violent (steeper slopes), with equity market busts three times more violent than credit market and housing market disruptions.
- Over the entire sample period, there are 24 credit, 28 housing and 63 equity market booms. Compared to typical upturns, booms are:
- Short, with time to recover previous peak shortest for the credit market (four quarters) and longest for the housing market (13 quarters).
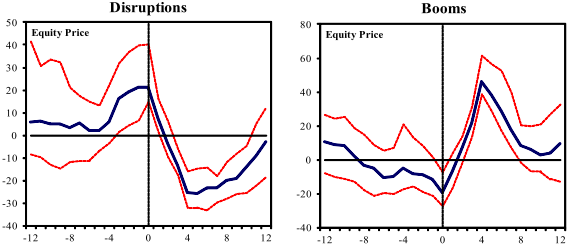
- Violent, with recovery slope two to three times larger (see second pair of charts below).
- Upturns and downturns are highly synchronized within countries, particularly for credit and housing markets (in the same phase 68% of the time). Credit crunches and housing market busts are mutual reinforcing, but equity market busts are shorter and shallower when they coincide with housing market busts.
- Synchronization across countries is high and increasing over time, particularly for credit and equity market cycles. Globally synchronized equity market downturns tend to be prolonged and costly (40% average drop, compared to 18% percent for other downturns).
- For all three markets, the longer a downturn lasts, the more likely it is to end.
The following pair of charts, taken from the paper, shows average duration of downturns for credit, housing and equity markets in 21 developed countries during 1960 through 2007. As described above, downturn (upturn) duration is the number of quarters from peak to trough (to recover the previous peak after a trough). Blue columns are for all observations, while red columns are for the extreme fourths of downturns and upturns (Disruption/Boom). Disruptions tend to be longer, deeper and more violent than other downturns, and booms tend to be shorter and faster than other upturns.

The next pair of charts, also from the paper, presents average profiles of equity market busts (Disruptions) and booms over the 1960-2007 sample period. The blue line is the median year-over-year equity market return, and the red lines are returns for the upper and lower fourths of observations. Quarter zero is the beginning of equity market disruption or boom. Intervals of rapid increases tend to precede equity market disruptions, which are typically sharp and prolonged. Booms tend to occur over the four quarters after pronounced declines, followed by reversals.

In summary, evidence suggests that financial market cycles are typically years in duration, variable over time and often correlated within and across countries.
Cautions regarding findings include:
- Cycle (peak and trough) identification is methodologically retrospective.
- Assumptions used in defining cycle peaks and troughs may to some degree pre-determine findings. Results may be fractal with respect to variation in these assumptions.
- The interpretation of means and medians as “typical” depends on tameness of sample distributions. To the extent that the distributions are actually wild, mean and median break down as expectations.
- The sample is not large in terms of number of correlated cycles.